
Radar now plots your IPv4 and IPv6 locations on the IP page ↗, shows the Cloudflare data centers serving your connection, and includes more detail about the autonomous system (AS) your primary IP belongs to.
The map of your connection now shows:
- IP location markers — The primary IP will show as a red marker. When both IP addresses do not geolocate to the same place, a second marker will appear in blue with a note explaining why IPv4 and IPv6 can resolve to different locations.
- Cloudflare data center markers — Cloudflare data centers now show as orange dots on the map and the one you are connected to is highlighted.
- Data center connectors — Each line connects your IP markers to their respective data centers.
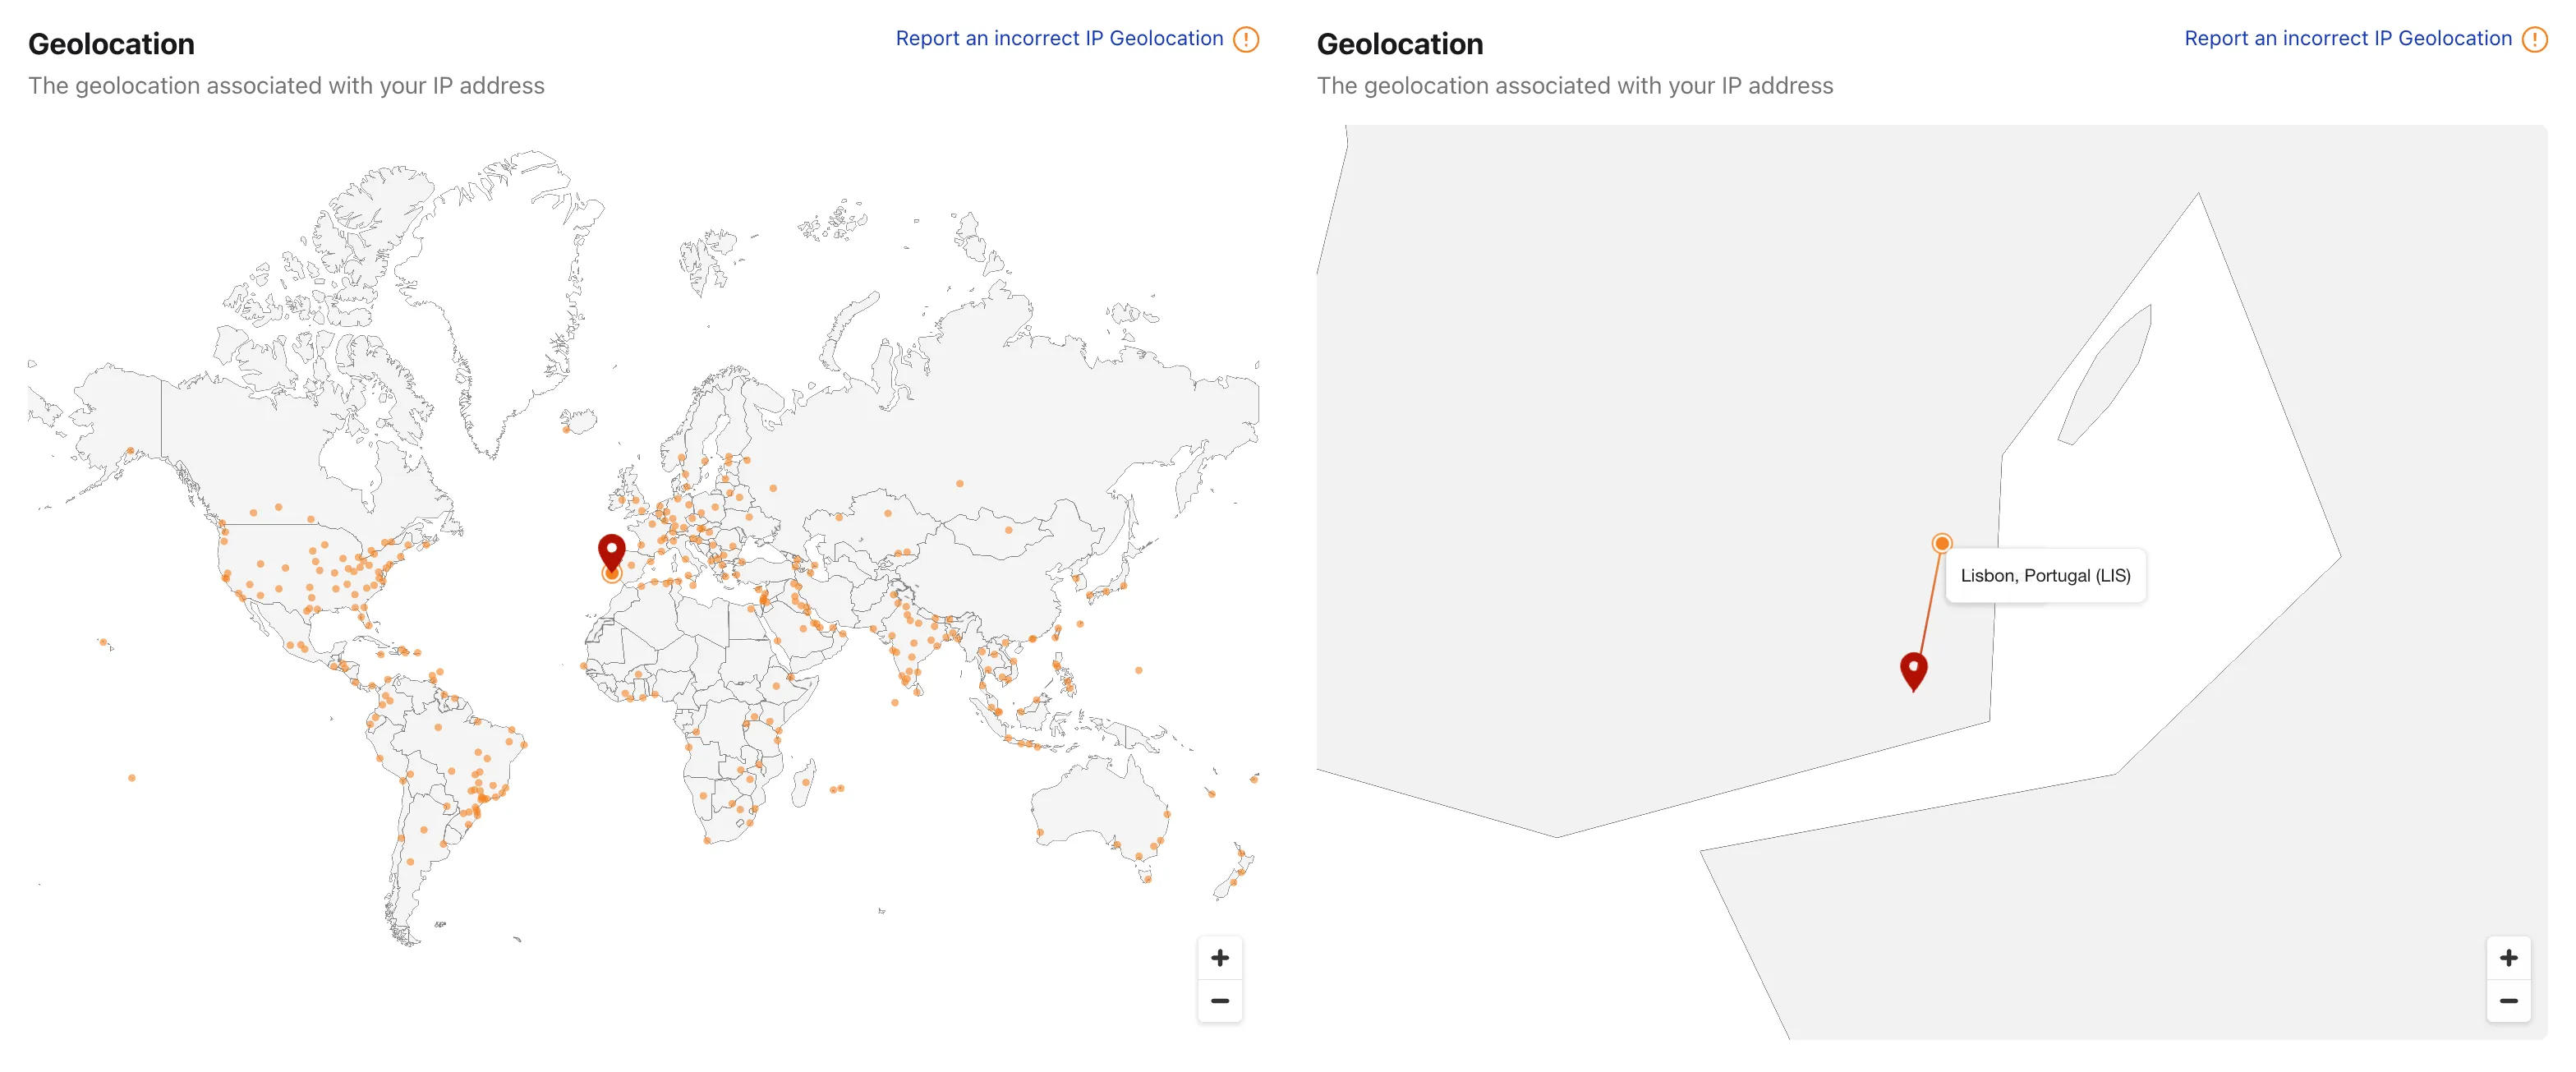
Due to the data policies of our geolocation provider, this detailed location is only available for your own IP. Other IP addresses keep the current country-level view.
The AS card on the IP page now shows additional detail about the network an IP belongs to — including alternate names, the operator website, and an estimate of the AS user population — alongside the AS number and country.
Visit the Cloudflare Radar IP page ↗ to explore more details about your IP.
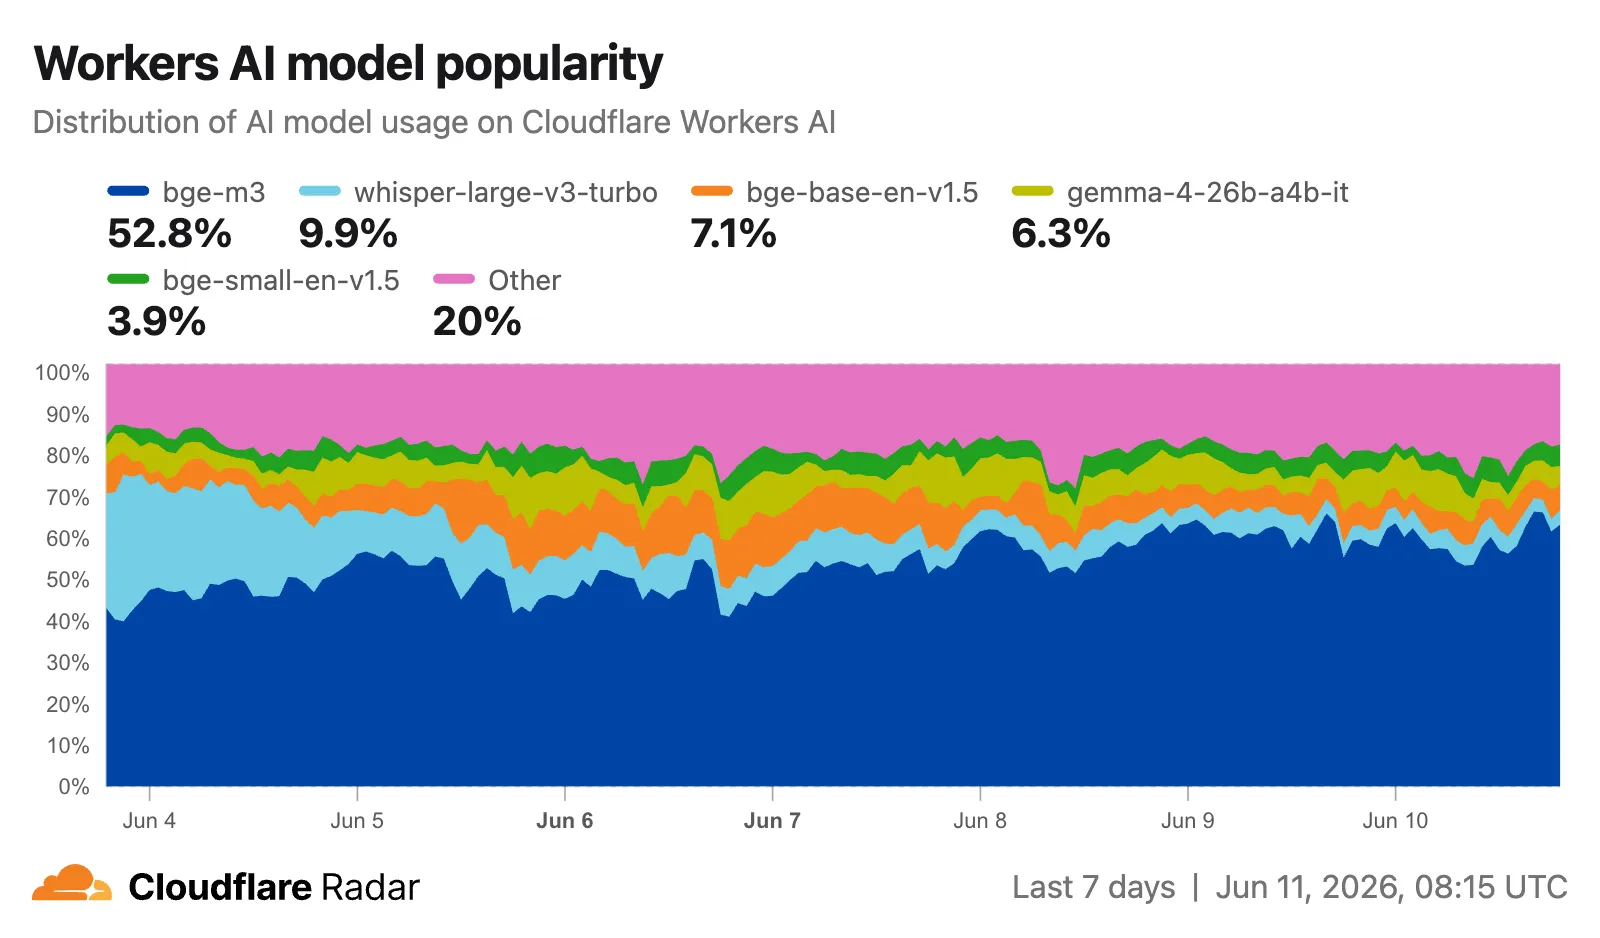
Radar has changed how it measures Workers AI model and task popularity.
Previously, popularity was based on the number of unique accounts running inferences against each model or task. It is now based on the number of inferences, giving a more representative view of actual usage volume. This change will affect all new measurements as well as historical data. As a result, the model and task distributions shown on Radar may differ from what you saw previously, and historical trends may shift accordingly.
The Workers AI model popularity ↗ chart shows the distribution of inferences across models.
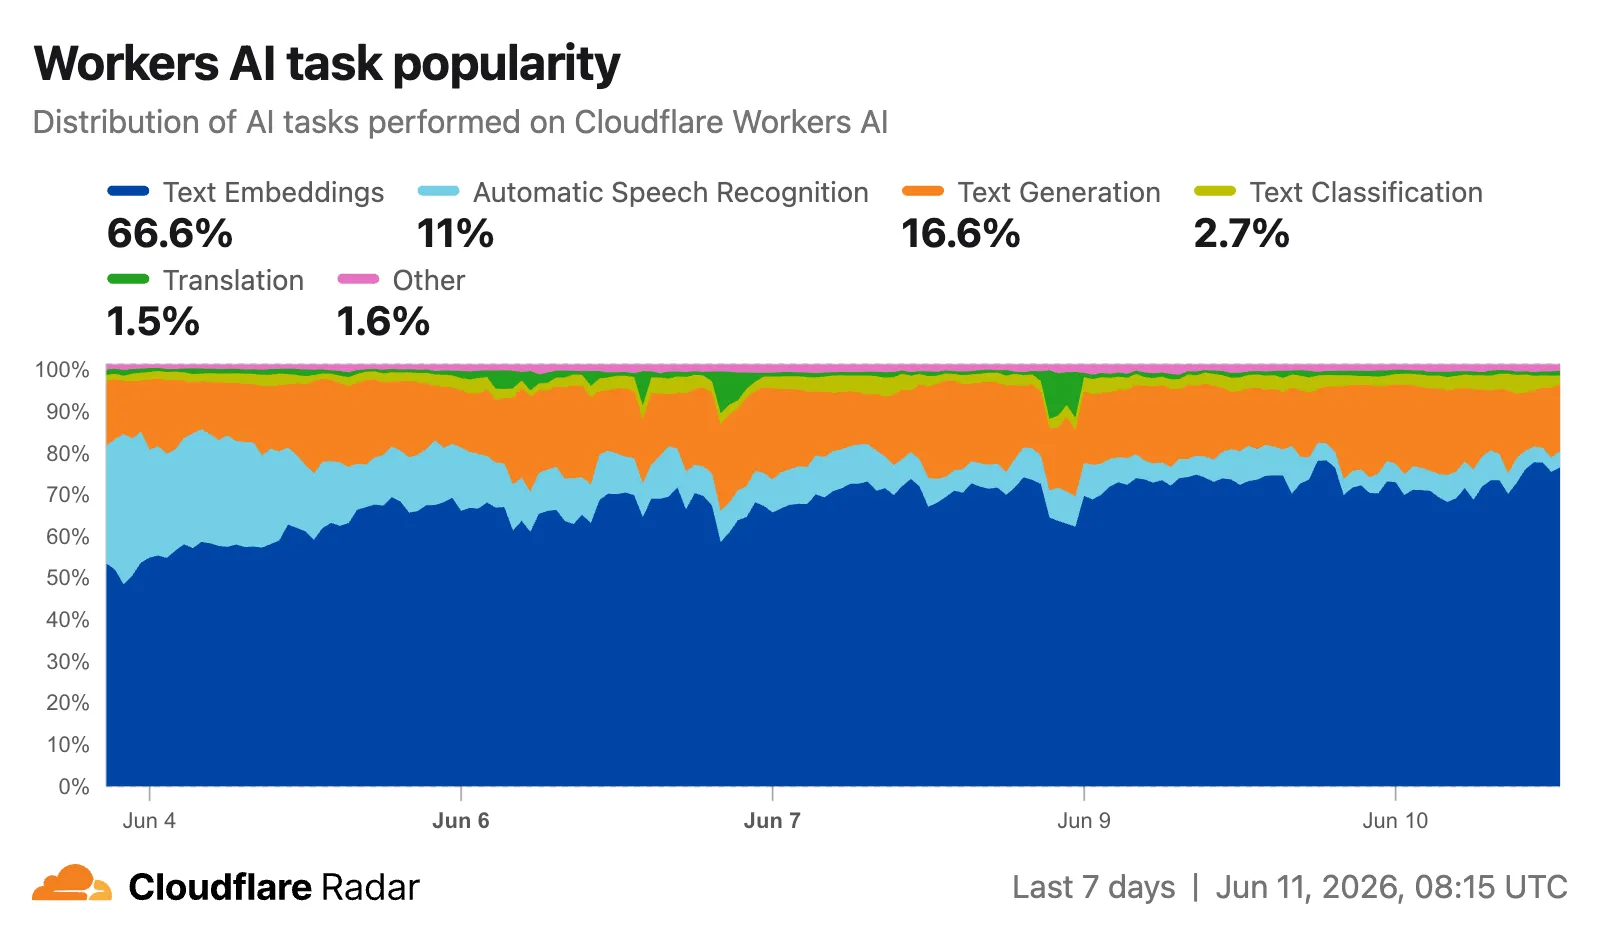
The Workers AI task popularity ↗ chart shows the distribution of inferences across tasks.
The same data is available via the following API endpoints:
Explore the data on the AI Insights page ↗.
Radar now provides finer-grained traffic charts for longer time ranges. Previously, selecting a 1-3 month view on HTTP and NetFlows charts defaulted to weekly aggregation, which was too coarse to surface meaningful trends. Views longer than 3 months defaulted to monthly aggregation, returning as few as 7 data points for a 6-month range.
The new defaults are:
- 1-3 months: daily granularity (7x more data points)
- Longer than 3 months (HTTP and NetFlows): weekly granularity (4x more data points)
For example, a 12-week traffic view previously showed weekly data:

The same view now shows daily data:

Similarly, a 1-year HTTP traffic view that previously showed just 12 monthly data points now provides 52 weekly data points.
Visit Cloudflare Radar ↗ to explore the new granular views.
The Radar post-quantum TLS support checker ↗ now also reports TLS bugs detected during the handshake test. When a scanned host exhibits compatibility issues, the results include details on the specific bugs detected, along with guidance on how to investigate and remediate each issue. The bugs section only appears for hosts where issues are found.
The following TLS bugs are detected:
- Split ClientHello — The connection fails with a fragmented post-quantum
ClientHellobut succeeds with classical handshakes. Typically caused by middleboxes or firewalls that cannot reassemble split TLS messages. - HRR Failure — The server sends a
HelloRetryRequestbut fails to complete the handshake afterward. - Unknown Keyshare — The server cannot handle unknown key exchange algorithms and fails instead of responding with a
HelloRetryRequestas required by the TLS 1.3 specification.

Bug detection data is available through the existing
/post_quantum/tls/supportendpoint.Visit the Post-Quantum Encryption ↗ page to test a host.
- Split ClientHello — The connection fails with a fragmented post-quantum
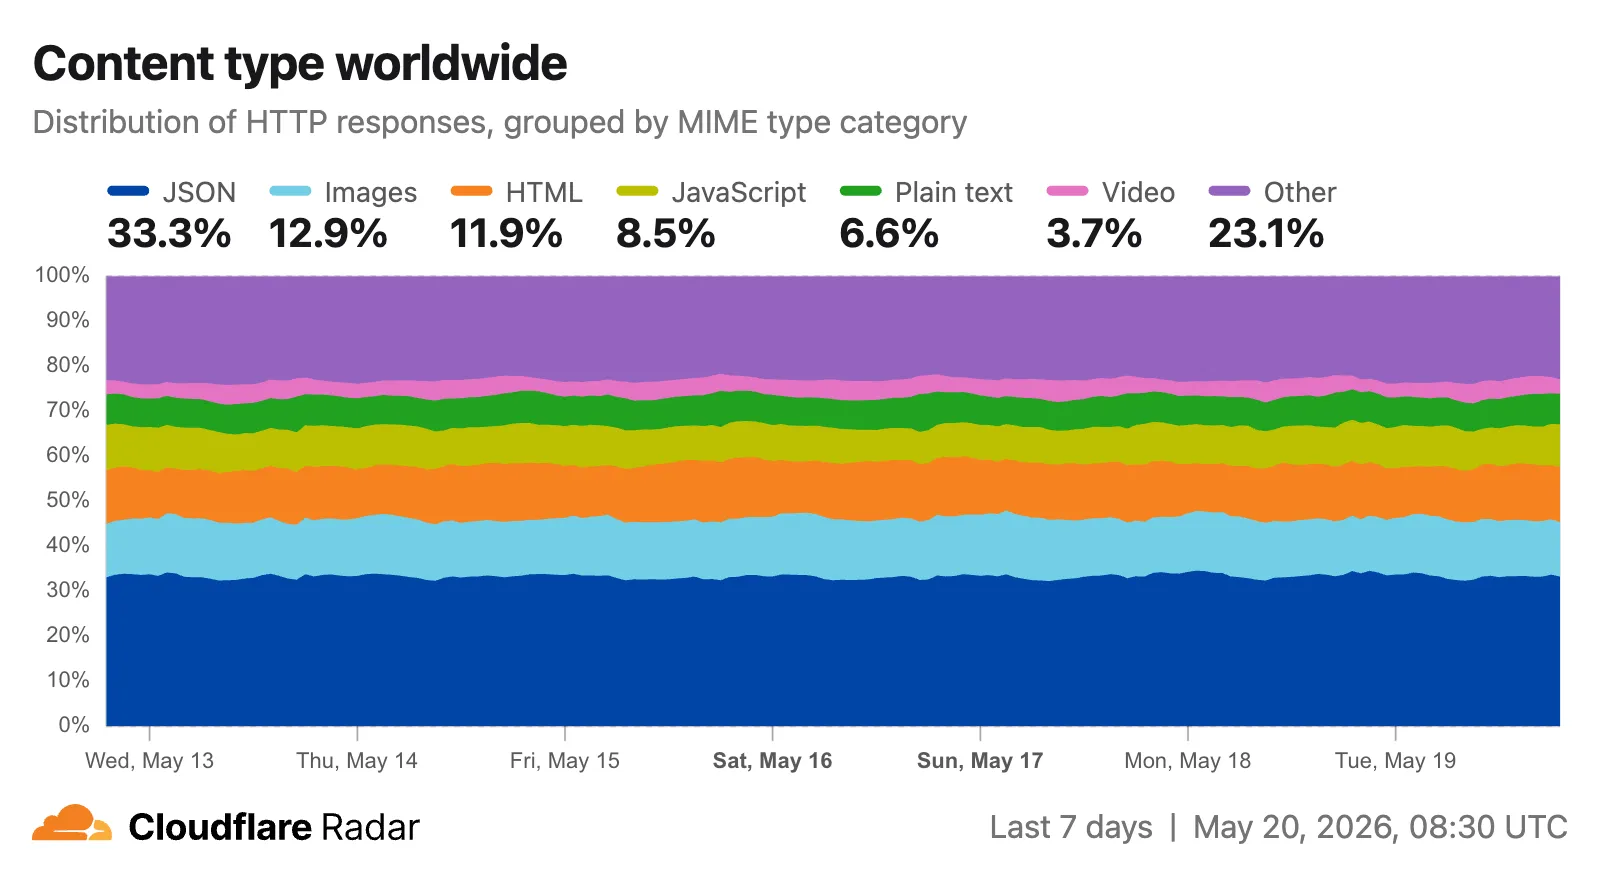
Radar now includes two new charts on the traffic page ↗ that provide deeper insights into the composition of HTTP traffic: a content type distribution chart and an API traffic share chart.
The new Content type ↗ chart displays the distribution of HTTP response content types, grouped into high-level categories. A traffic type selector allows filtering by human, bot, or all traffic. The existing Bot vs. Human ↗ chart also gained a content type category filter, allowing users to see the bot/human split for specific content categories.
Content type categories:
- HTML — Web pages (
text/html) - Images — All image formats (
image/*) - JSON — JSON data and API responses (
application/json,*+json) - JavaScript — Scripts (
application/javascript,text/javascript) - CSS — Stylesheets (
text/css) - Plain Text — Unformatted text (
text/plain) - Fonts — Web fonts (
font/*,application/font-*) - XML — XML documents and feeds (
text/xml,application/xml,application/rss+xml,application/atom+xml) - YAML — Configuration files (
text/yaml,application/yaml) - Video — Video content and streaming (
video/*,application/ogg,*mpegurl) - Audio — Audio content (
audio/*) - Markdown — Markdown documents (
text/markdown) - Documents — PDFs, Office documents, ePub, CSV (
application/pdf,application/msword,text/csv) - Binary — Executables, archives, WebAssembly (
application/octet-stream,application/zip,application/wasm) - Serialization — Binary API formats (
application/protobuf,application/grpc,application/msgpack) - Other — All other content types
The
CONTENT_TYPEdimension andcontentTypefilter are available on the HTTP summary, timeseries groups, and timeseries endpoints.The new API traffic ↗ chart shows the percentage of dynamic (non-cacheable) HTTP request traffic that is API-related. API traffic is identified by JSON or XML response content types (
application/json,application/xml,text/xml) on HTTP requests that returned a 200 status code. A traffic type selector allows switching between human traffic, bot traffic, or all traffic.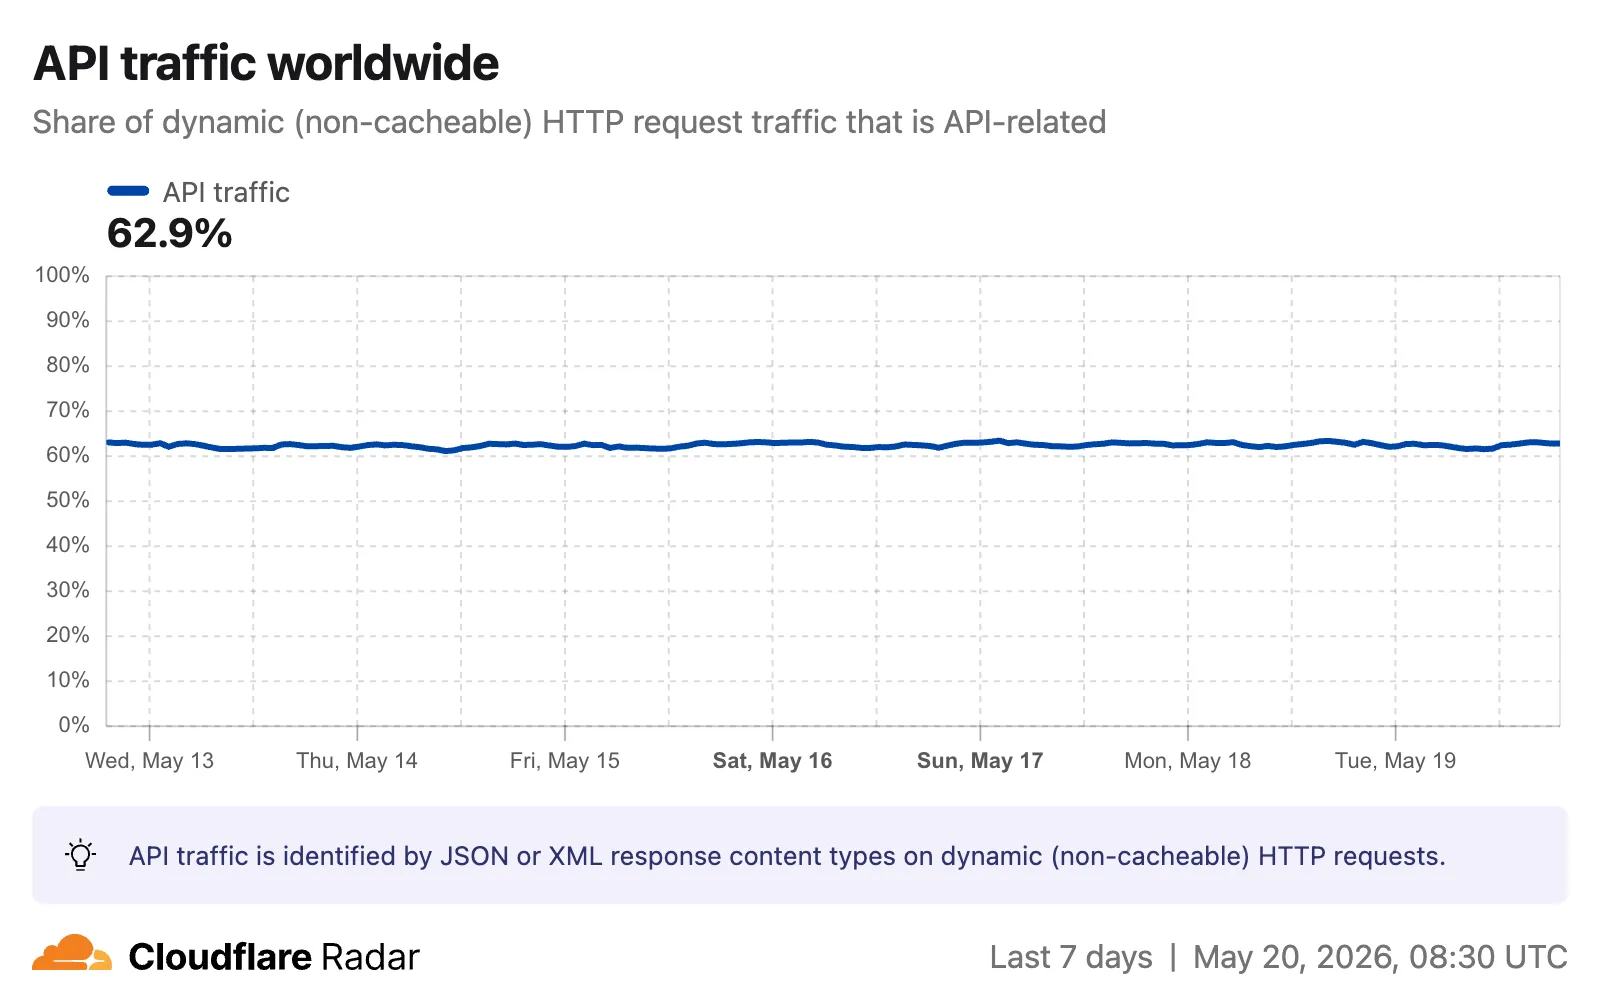
The
API_TRAFFICdimension is available on the existing HTTP summary and timeseries groups endpoints. AnapiTrafficfilter (APIorNON_API) can also be applied to HTTP timeseries requests to retrieve raw request counts for API-only or non-API traffic.Visit the Radar traffic page ↗ to explore these new charts.
- HTML — Web pages (
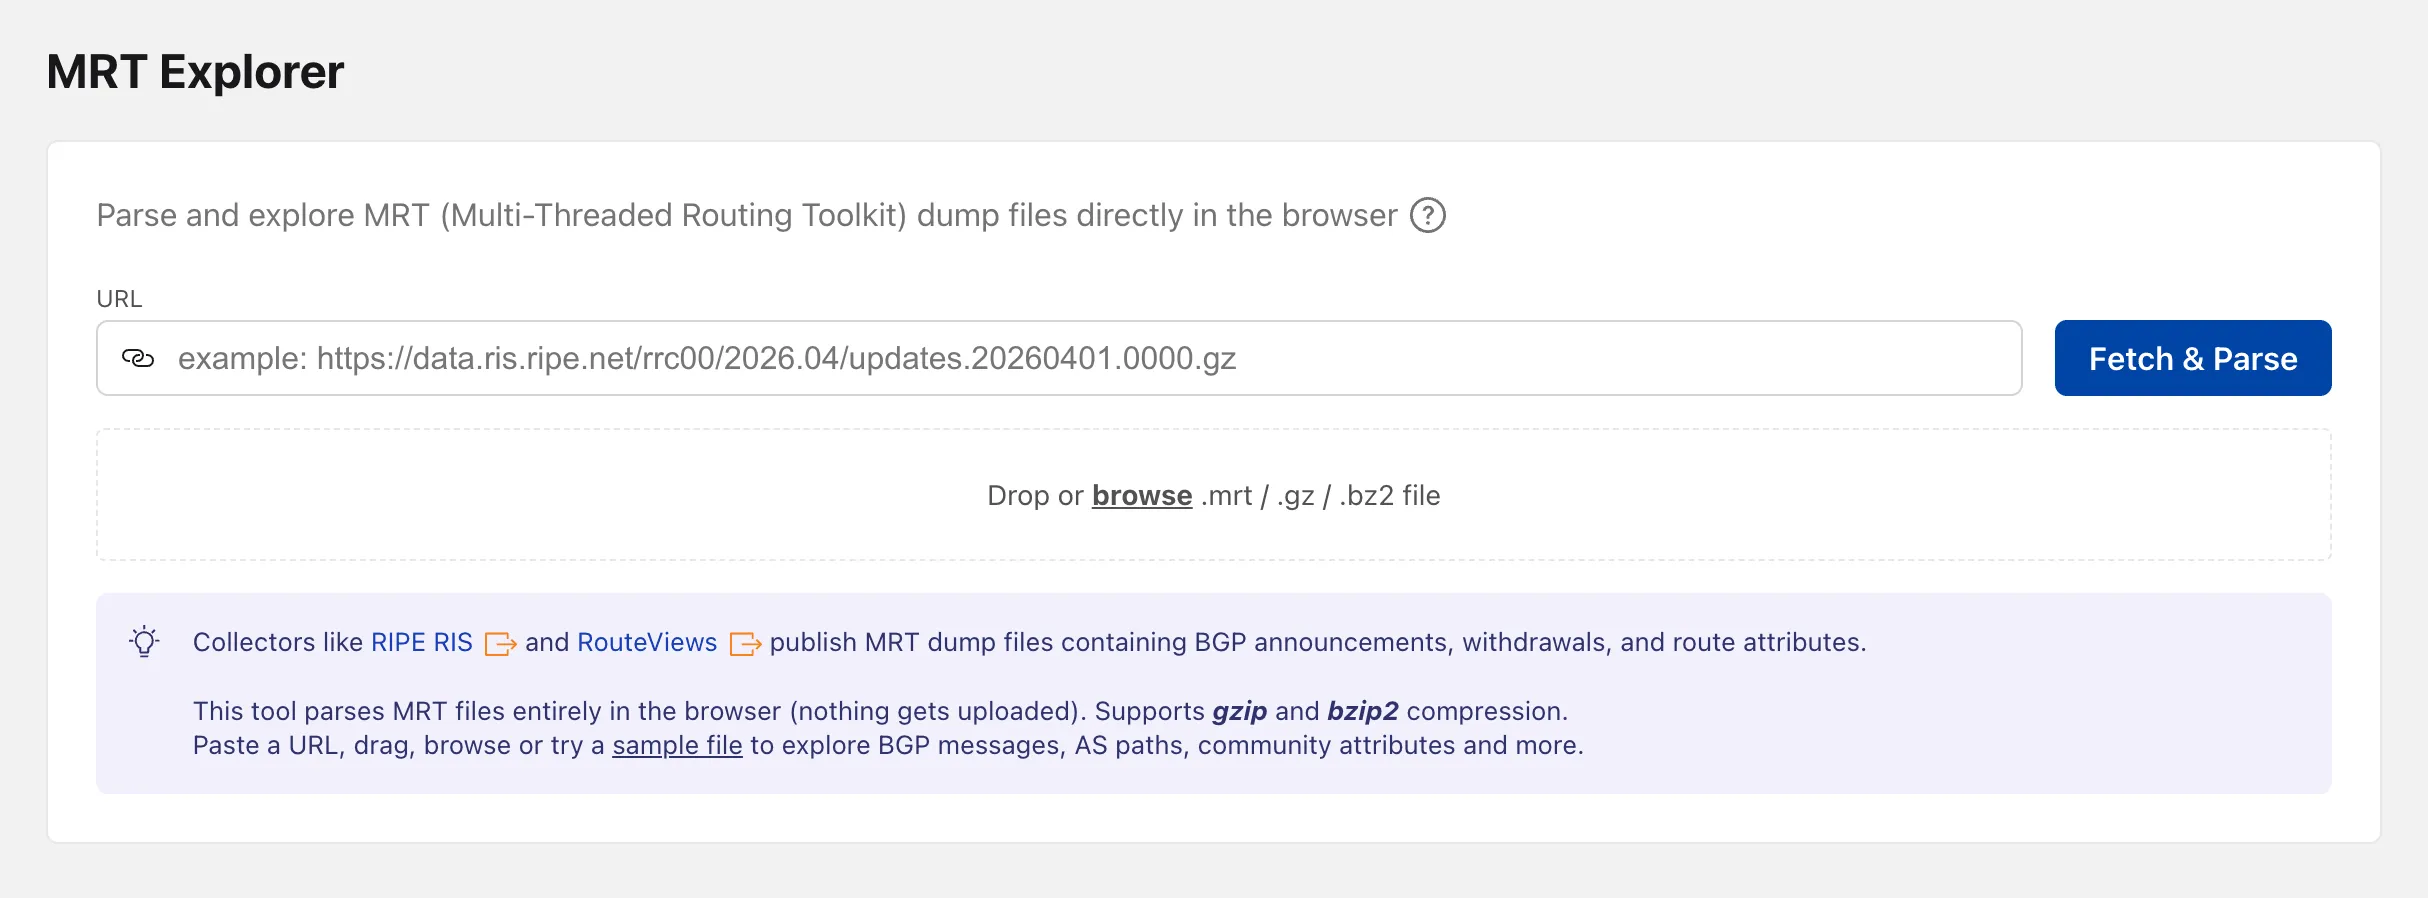
Radar now includes an MRT Explorer ↗ tool in the Routing section. Route collectors like RIPE RIS and RouteViews publish MRT (Multi-Threaded Routing Toolkit) dump files containing BGP announcements, withdrawals, and route attributes. The new tool parses these files entirely in the browser — nothing gets uploaded.
Paste a URL to fetch an MRT file remotely, drag and drop one onto the page, or browse for a local file. Gzip and bzip2 compressed files are supported. A sample file is also available to get started right away.
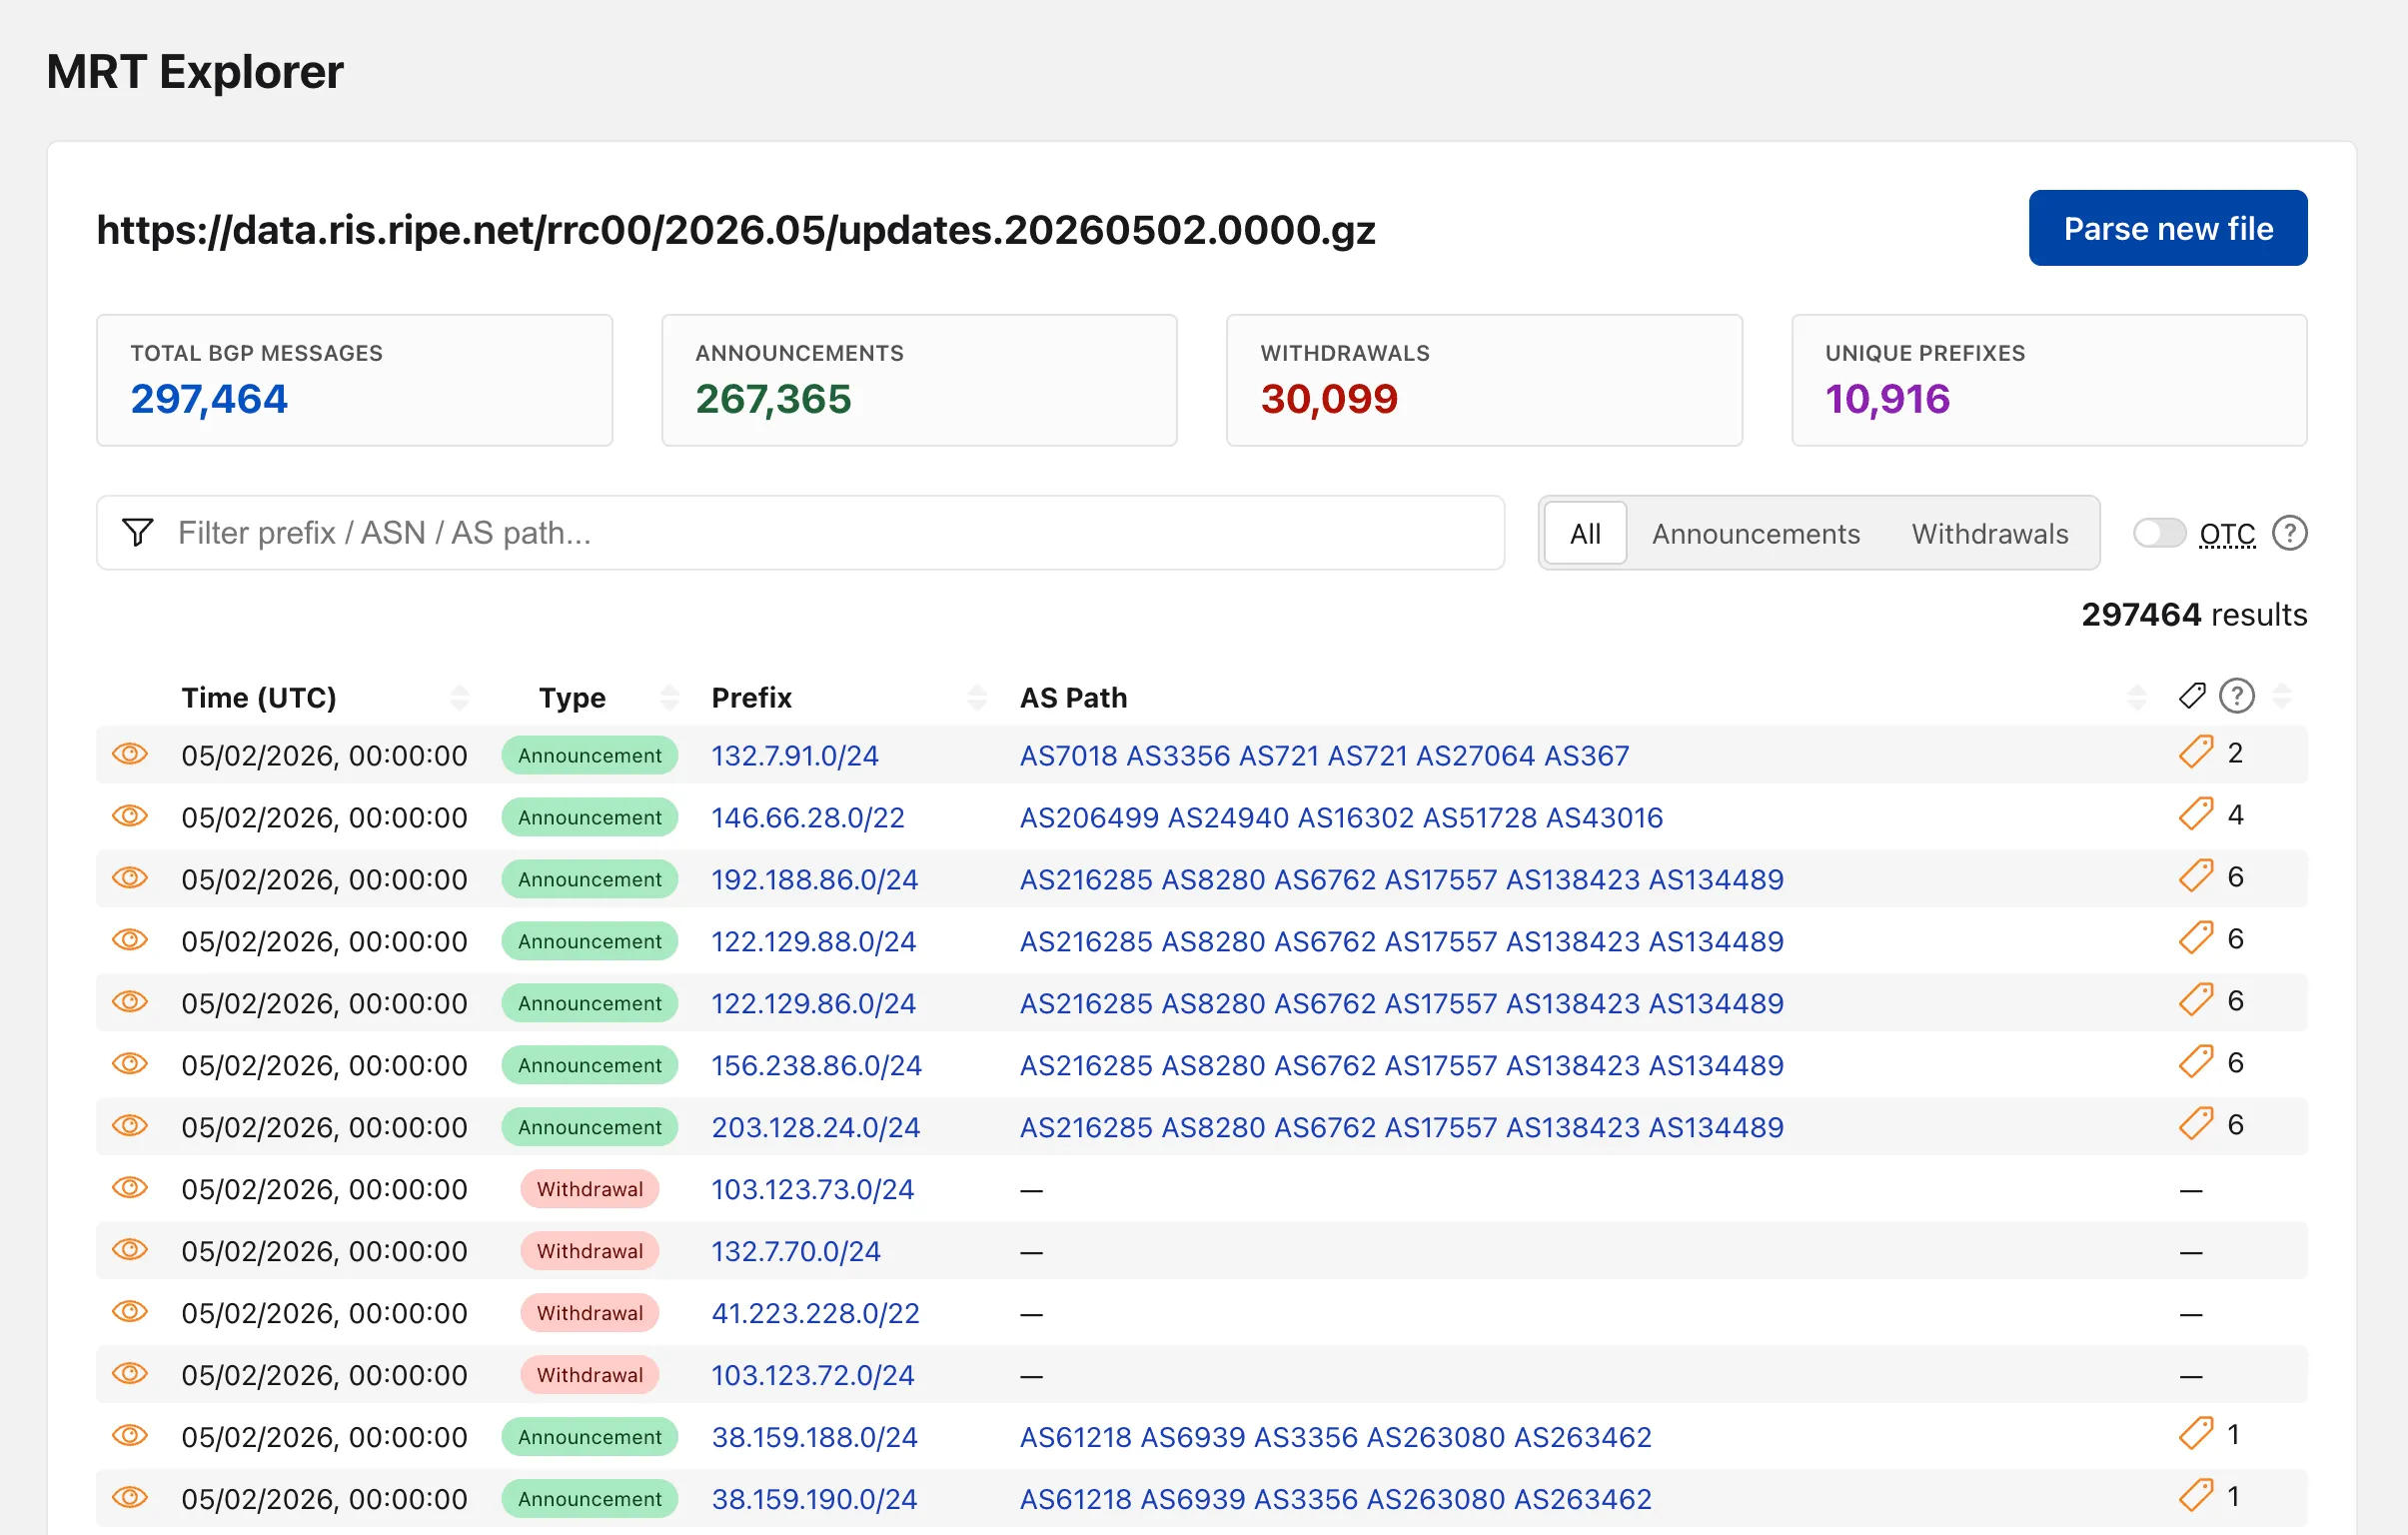
Once parsed, the tool lists every BGP event with its timestamp, prefix, AS path, OTC (Only to Customer), and community attributes.
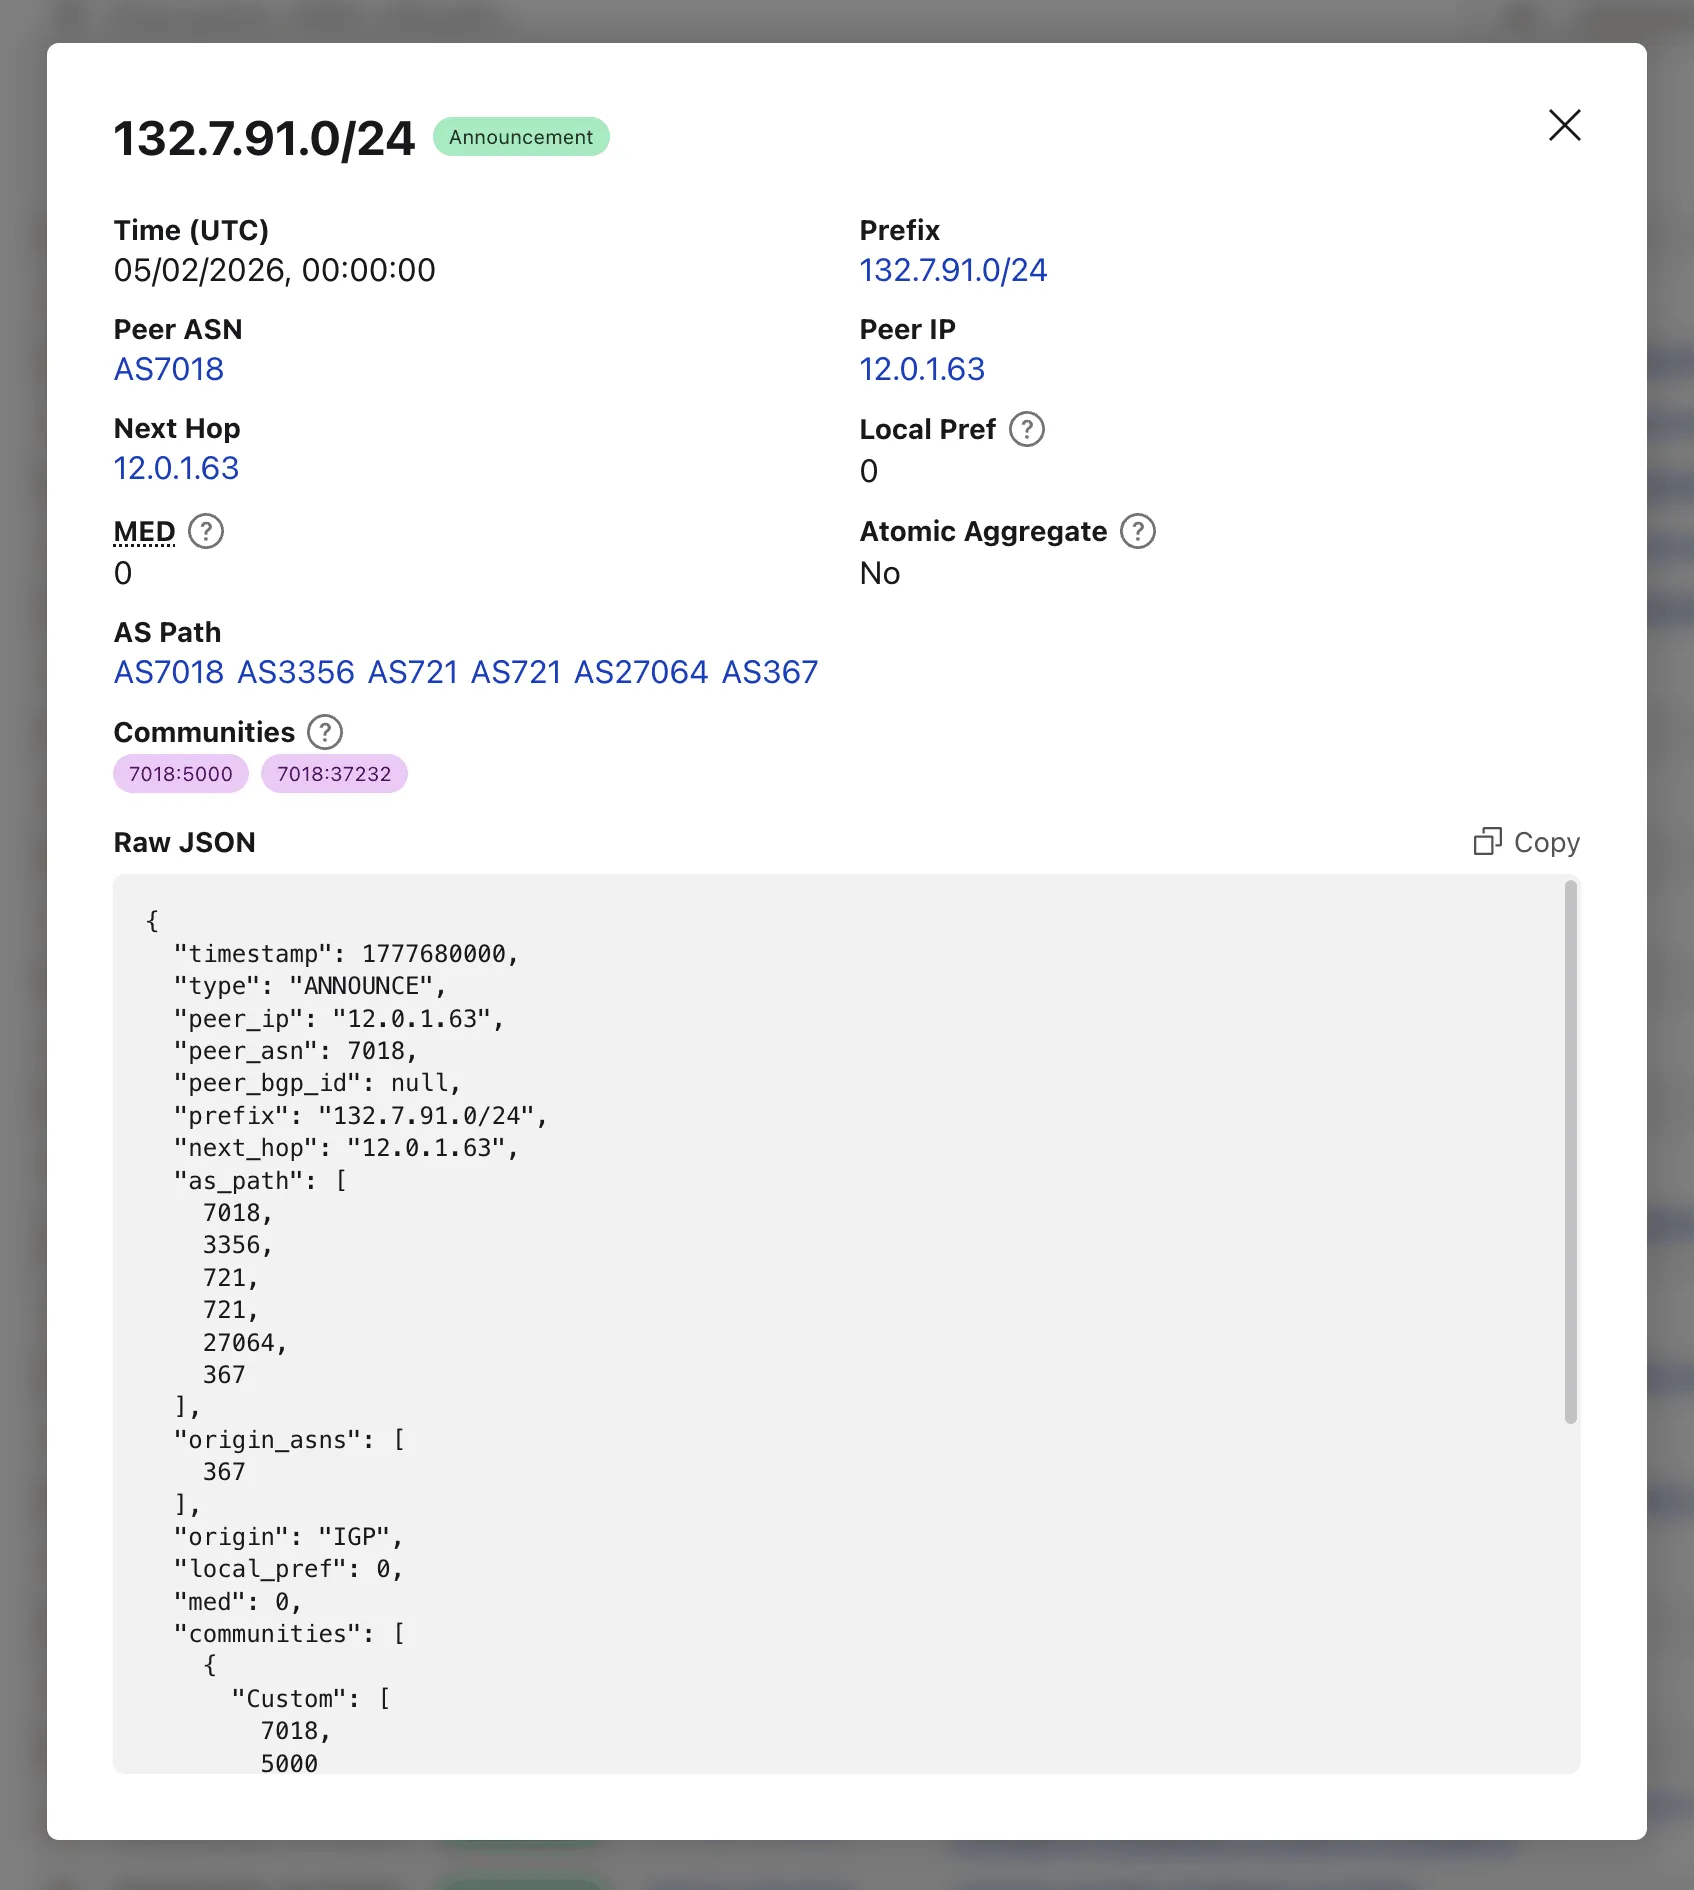
Clicking on the "View details" action opens a modal with additional properties and the full event JSON.
When loading a file by URL, the query string captures the source so the link can be shared directly — the recipient's browser immediately fetches and parses the same file.
Try the MRT Explorer on Cloudflare Radar ↗.
Radar now provides TLD authoritative nameserver performance insights, measuring response time (latency) as observed from Cloudflare's 1.1.1.1 resolver infrastructure when forwarding queries upstream to TLD nameservers.
New widgets on TLD detail pages ↗:
- Aggregate nameserver latency ↗: Response time percentiles (p25/p50/p75) for all authoritative nameservers of the selected TLD.
- Latency per nameserver ↗: Median response time (p50) broken down by each authoritative nameserver over time.

- Median latency geographic distribution ↗: p50 response time by Cloudflare data center country, displayed on a choropleth map.
- TLD ranking over time ↗: Daily DNS magnitude rank and magnitude value with a Rank/Magnitude toggle.
- Rank change deltas ↗: 1 week, 4 weeks, and 3 months rank changes added to the TLD magnitude table and the TLD detail info panel.

The new
TLD PerformanceAPI provides the following endpoints:/tlds/performance/summary/{dimension}— TLD nameserver performance summarized by dimension./tlds/performance/timeseries_groups/{dimension}— TLD nameserver performance over time grouped by dimension.
Available dimensions:
LATENCY(aggregate p25/p50/p75),NAMESERVER_LATENCY(per-nameserver p50),LOCATION_LATENCY(per-data-center-country p50).TLD Performance is also available as a dataset in the Data Explorer ↗.
Check out the updated TLD detail page ↗.
Radar is expanding its Routing section ↗ with two new widgets that give a deeper view into how networks announce address space and how RPKI ROA coverage evolves over time.
Country routing pages now include a Top ASes by announced IP space chart, breaking down the IPv4 and IPv6 address space announced from a country across the autonomous systems that originate it. The chart stacks the IPv4 and IPv6 views vertically, with the top contributing ASes called out by color and the remaining networks aggregated as Other.

The RPKI sub-page ↗ adds an RPKI ROA deployment timeseries widget that tracks the share of announced BGP space covered by a valid Route Origin Authorization (ROA) over time, with separate IPv4 and IPv6 lines. A toggle switches the view between the share of covered prefixes and the share of covered IP address space. The widget is available on global, country, and AS views, so operators can monitor RPKI adoption progress and compare deployment trends across different scopes.

The data behind these widgets is also available through two new endpoints on the
BGPAPI:/bgp/ips/top/ases- Returns the top autonomous systems by announced IP space (IPv4/24s or IPv6/48s), globally or filtered by country, snapped to the nearest 8-hour RIB boundary./bgp/rpki/roas/timeseries- Returns RPKI ROA validation coverage over time, by share of prefixes or share of IP address space, split by IP version, with optional ASN or location filters.
Visit the Radar routing section ↗ to explore both widgets.
The Cloud Observatory ↗ on Radar now provides improved connection metric insights, offering new ways to explore TCP round-trip time, TCP handshake duration, TLS handshake duration, and response header receive duration across cloud provider origin servers.
The Cloud Observatory overview ↗ now shows connection metrics broken down by cloud provider, making it easy to compare connection performance across Amazon Web Services, Google Cloud, Microsoft Azure, and Oracle Cloud.

Each provider page ↗ now shows connection metrics for the top five regions, with a selector to rank by lowest or highest values.

Each region page ↗ now displays connection metrics as percentile distributions (25th percentile, median, and 75th percentile), providing insight into the range and variability of connection times.

These views are also available through the
OriginsAPI, using thetimeseries_groupsendpoint with theORIGIN,REGION, orPERCENTILEdimension.
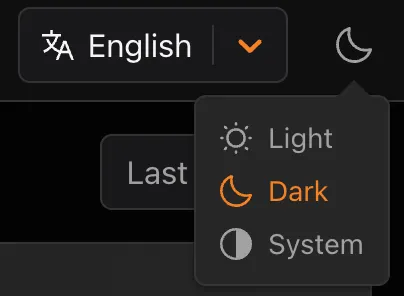
Radar now supports dark mode. A theme selector in the upper right corner of the page lets users explicitly choose between three display options:
- Light — standard light theme
- Dark — full dark theme
- System — follows the operating system preference
The selected theme applies consistently across all Radar pages and widgets.

The theme choice also applies to shared and embedded graphs.
Try it out at Cloudflare Radar ↗.
Radar adds three new features to the AI Insights ↗ page, expanding visibility into how AI bots, crawlers, and agents interact with the web.
The AI Insights page now includes an adoption of AI agent standards ↗ widget that tracks how websites adopt agent-facing standards. The data is filterable by domain category and updated weekly on Mondays. This data is also available through the Agent Readiness API reference.

URL Scanner ↗ reports now include an Agent readiness tab that evaluates a scanned URL against the criteria used by the Agent Readiness score tool ↗.

For more details, refer to the Agent Readiness blog post ↗.
A new savings gauge ↗ shows the median response-size reduction when serving Markdown instead of HTML to AI bots and crawlers. This highlights the bandwidth and token savings that Markdown for Agents provides.

For more details, refer to the Markdown for Agents API reference.
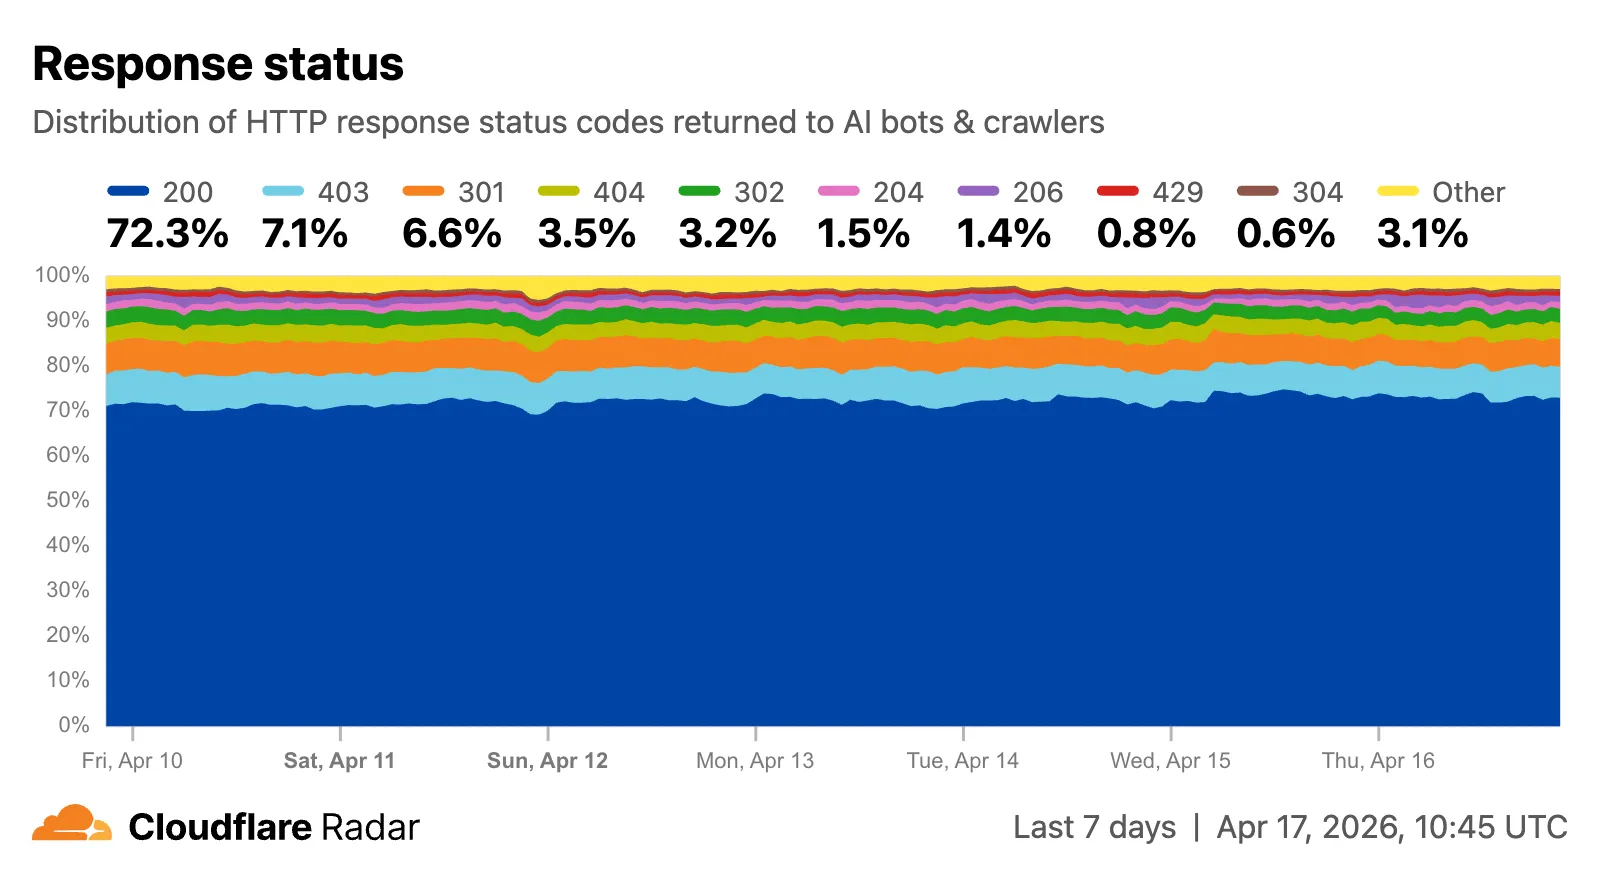
The new response status widget ↗ displays the distribution of HTTP response status codes returned to AI bots and crawlers. Results are groupable by individual status code (200, 403, 404) or by category (2xx, 3xx, 4xx, 5xx).
The same widget is available on each verified bot's detail page (only available for AI bots), for example Google ↗.
Explore all three features on the Cloudflare Radar AI Insights ↗ page.
Radar shareable widgets now include a generate citation action, making it easier to reference Cloudflare Radar ↗ data in research papers and other publications.

Select the citation icon to open a modal with five supported citation styles:
- BibTeX
- APA
- MLA
- Chicago
- RIS

Explore the feature on any shareable widget at Cloudflare Radar ↗.
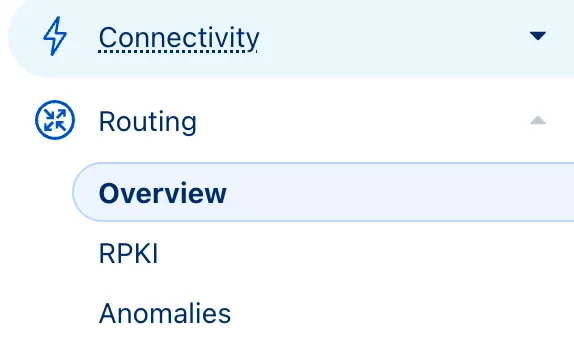
Radar now features an expanded Routing section ↗ with dedicated sub-pages, providing a more organized and in-depth view of the global routing ecosystem. This restructuring lays the groundwork for additional routing features and widgets coming in the near future.
The single Routing page has been split into three focused sub-pages:
- Overview ↗ — Routing statistics, IP address space trends, BGP announcements, and the new Top 100 ASes ranking.
- RPKI ↗ — RPKI validation status, ASPA deployment trends, and per-ASN ASPA provider details.
- Anomalies ↗ — BGP route leaks, origin hijacks, and Multi-Origin AS (MOAS) conflicts.
The routing overview now includes a Top 100 ASes table ranking autonomous systems by customer cone size, IPv4 address space, or IPv6 address space. Users can switch between rankings using a segmented control.

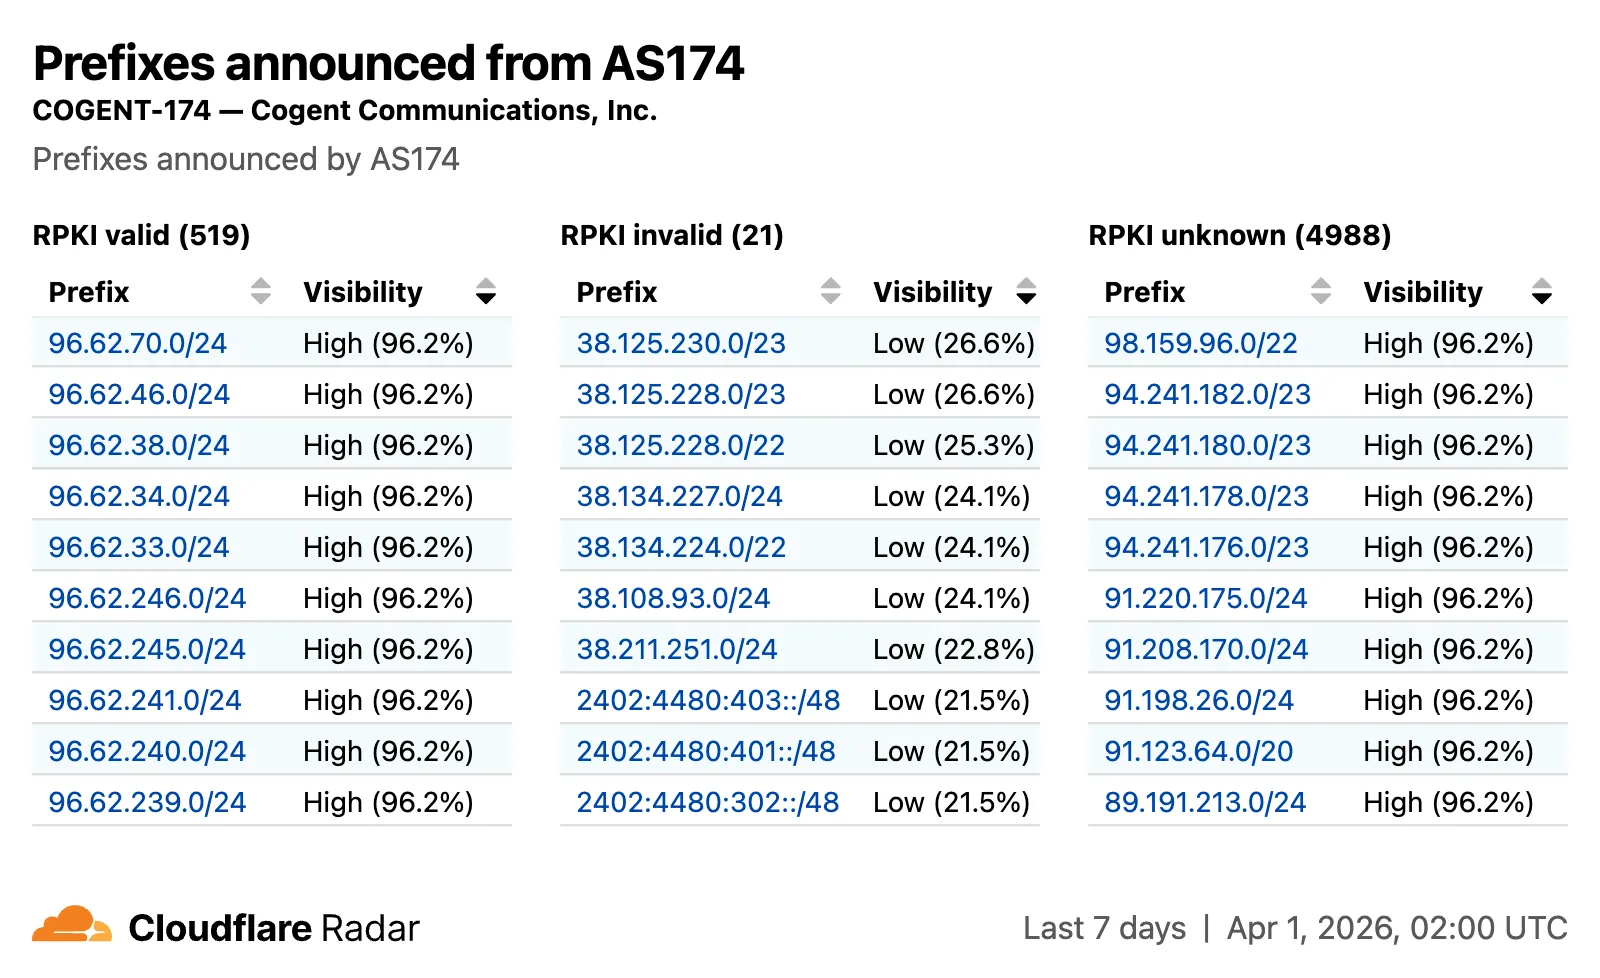
The RPKI sub-page introduces a RPKI validation view for per-ASN pages, showing prefixes grouped by RPKI validation status (Valid, Invalid, Unknown) with visibility scores.
The IP address space ↗ chart now displays both IPv4 and IPv6 trends stacked vertically and is available on global, country, and AS views.

Check out the Radar routing section ↗ to explore the data, and stay tuned for more routing insights coming soon.
Radar ships several improvements to the URL Scanner ↗ that make scan reports more informative and easier to share:
- Live screenshots — the summary card now includes an option to capture a live screenshot of the scanned URL on demand using the Browser Rendering API.
- Save as PDF — a new button generates a print-optimized document aggregating all tab contents (Summary, Security, Network, Behavior, and Indicators) into a single file.
- Download as JSON — raw scan data is available as a JSON download for programmatic use.
- Redesigned summary layout — page information and security details are now displayed side by side with the screenshot, with a layout that adapts to narrower viewports.
- File downloads — downloads are separated into a dedicated card with expandable rows showing each file's source URL and SHA256 hash.
- Detailed IP address data — the Network tab now includes additional detail per IP address observed during the scan.

Explore these improvements on the Cloudflare Radar URL Scanner ↗.
Radar ships several new features that improve the flexibility and usability of the platform, as well as visibility into what is happening on the Internet.
All location-aware pages now support filtering by region, including continents, geographic subregions (Middle East ↗, Eastern Asia ↗, etc.), political regions (EU ↗, African Union ↗), and US Census regions/divisions (for example, New England ↗, US Northeast ↗).

A new traffic volume view shows the top autonomous systems and countries/territories for a given location. This is useful for quickly determining which network providers in a location may be experiencing connectivity issues, or how traffic is distributed across a region.

The new AS and location dimensions have also been added to the Data Explorer ↗ for the HTTP, DNS, and NetFlows datasets. Combined with other available filters, this provides a powerful tool for generating unique insights.

Finally, breadcrumb navigation is now available on most pages, allowing easier navigation between parent and related pages.
Check out these features on Cloudflare Radar ↗.
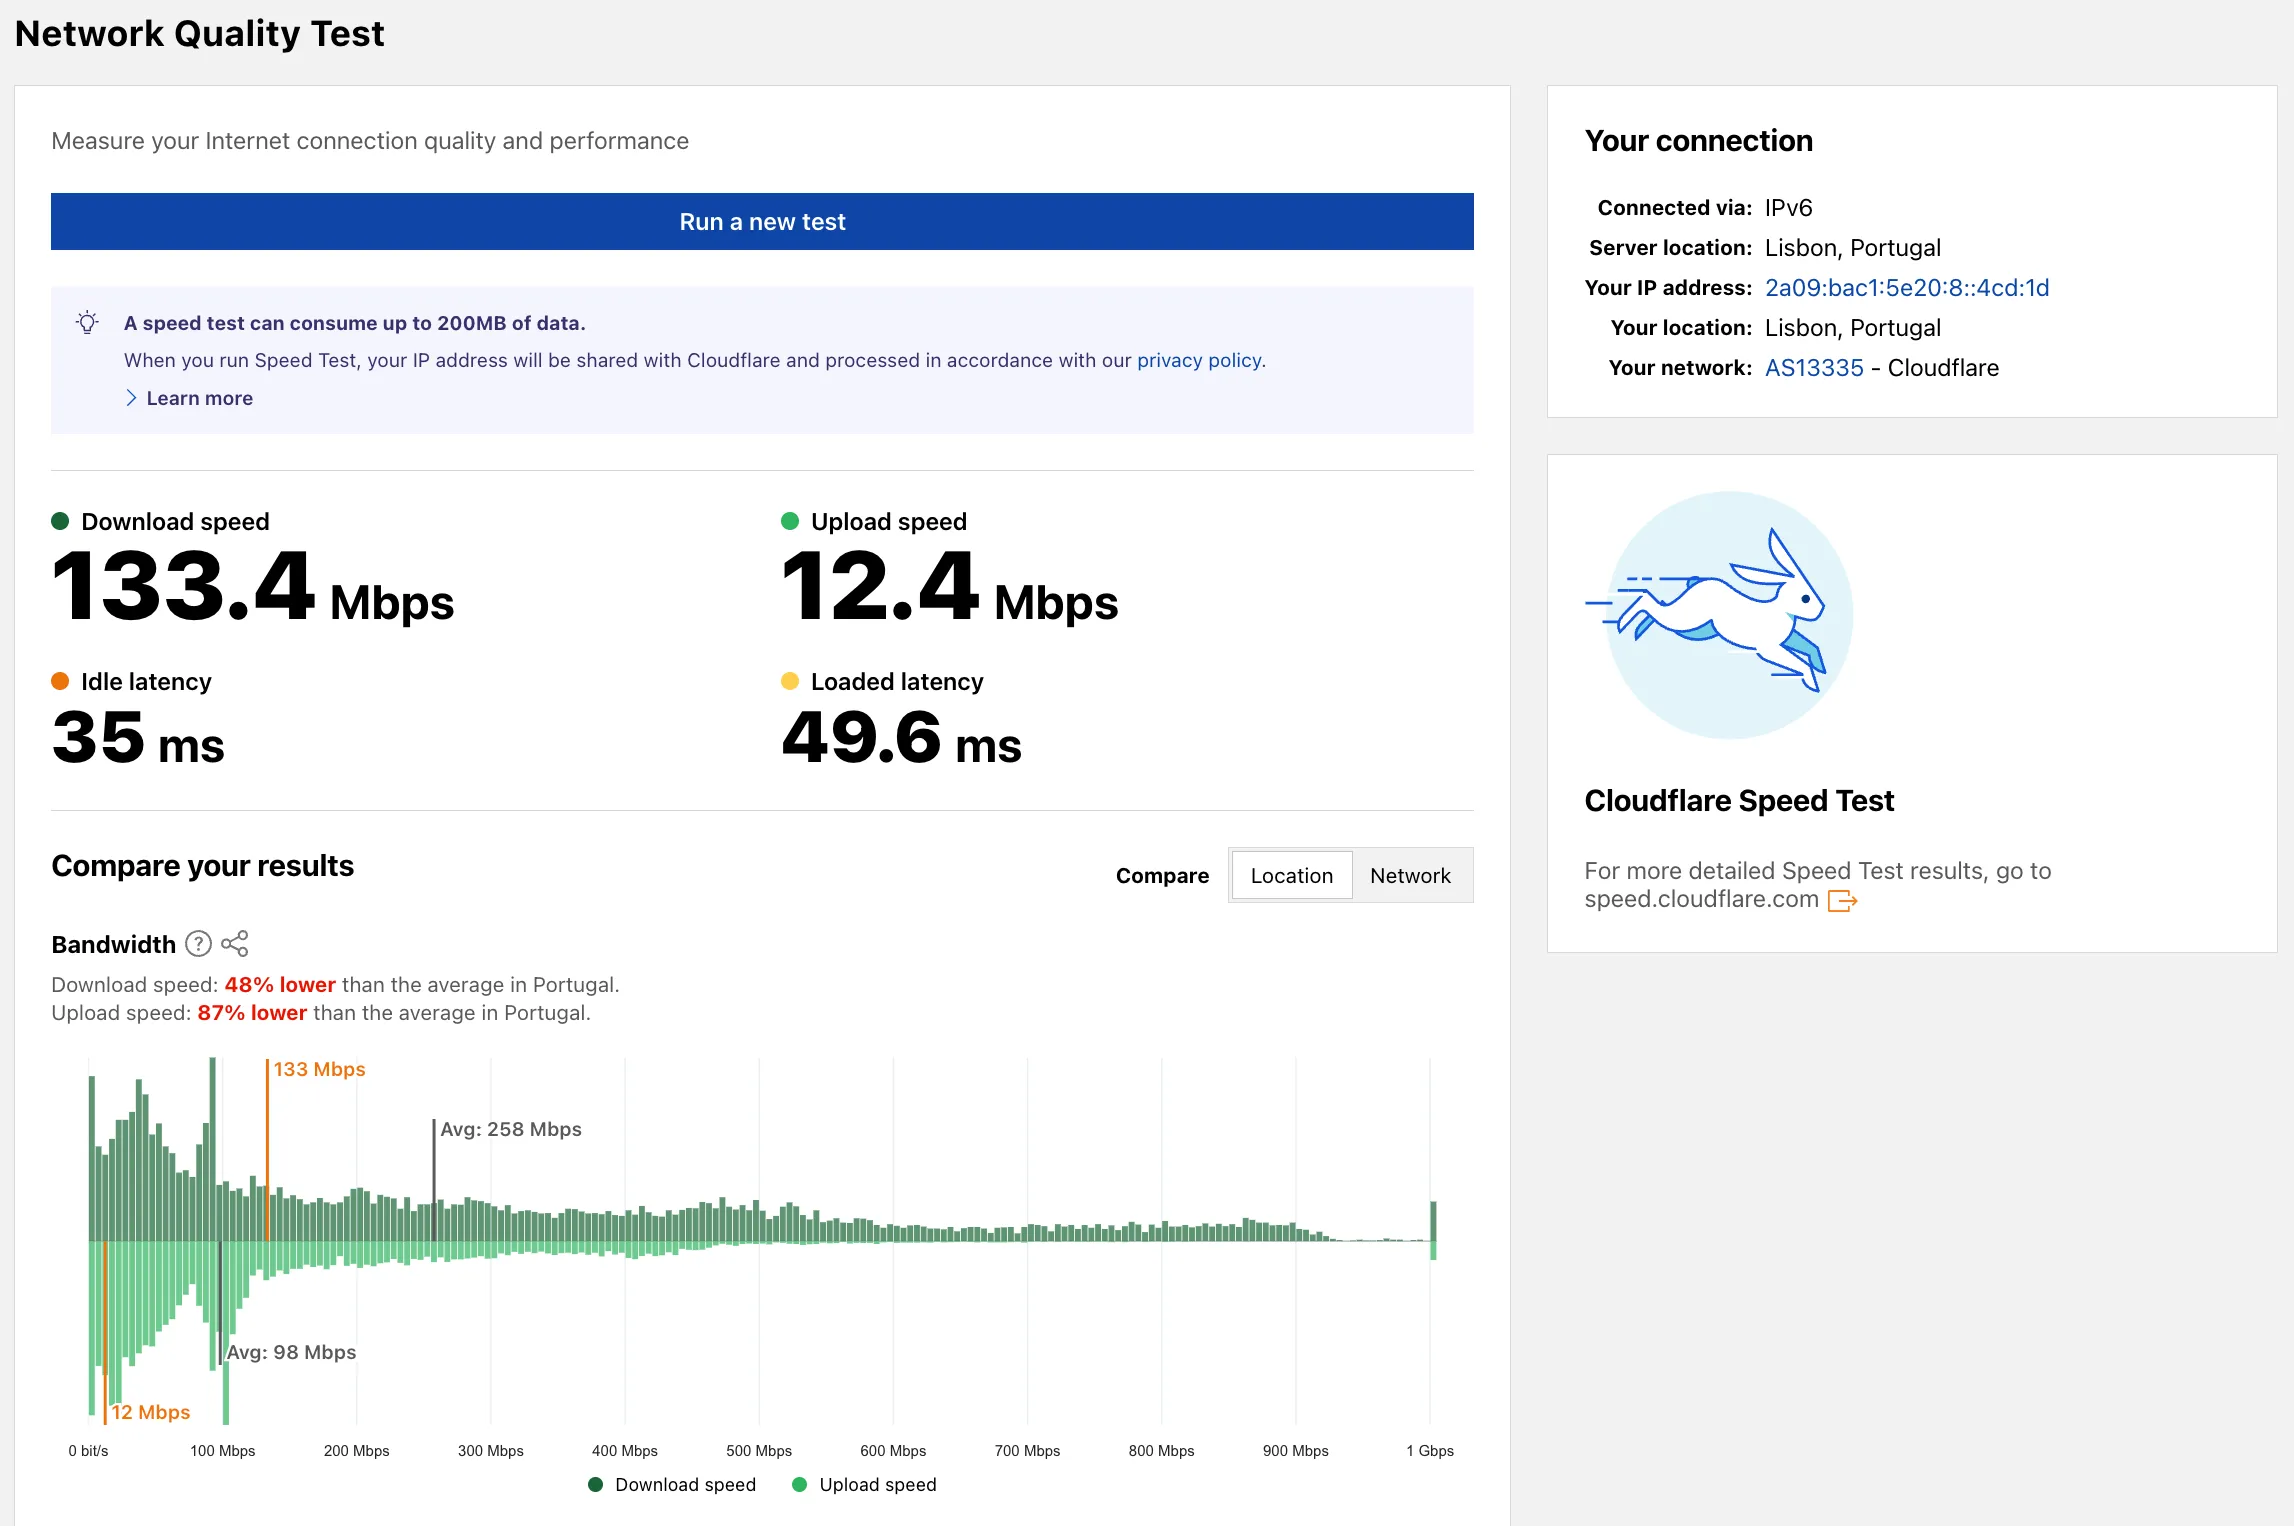
Radar now includes a Network Quality Test ↗ page. The tool measures Internet connection quality and performance, showing connection details such as IP address, server location, network (ASN), and IP version. For more detailed speed test results, the page links to speed.cloudflare.com ↗.
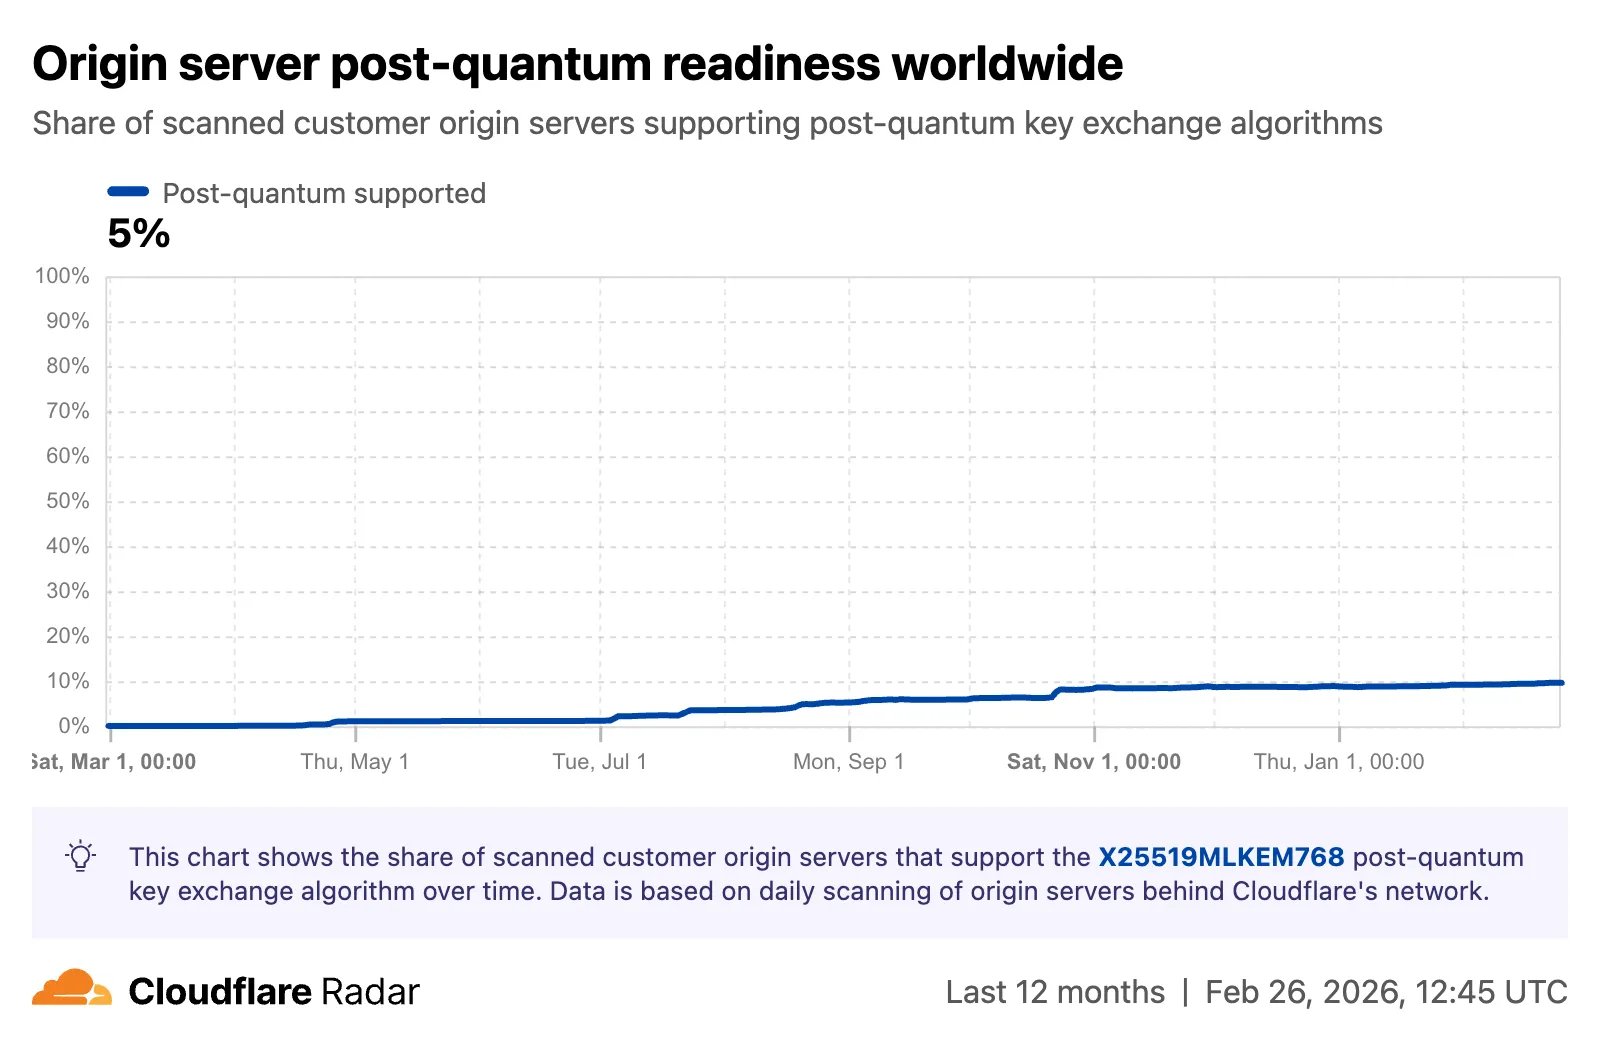
Radar now tracks post-quantum encryption support on origin servers, provides a tool to test any host for post-quantum compatibility, and introduces a Key Transparency dashboard for monitoring end-to-end encrypted messaging audit logs.
The new
Post-QuantumAPI provides the following endpoints:/post_quantum/tls/support- Tests whether a host supports post-quantum TLS key exchange./post_quantum/origin/summary/{dimension}- Returns origin post-quantum data summarized by key agreement algorithm./post_quantum/origin/timeseries_groups/{dimension}- Returns origin post-quantum timeseries data grouped by key agreement algorithm.
The new Post-Quantum Encryption ↗ page shows the share of customer origins supporting X25519MLKEM768, derived from daily automated TLS scans of TLS 1.3-compatible origins. The scanner tests for algorithm support rather than the origin server's configured preference.
A host test tool allows checking any publicly accessible website for post-quantum encryption compatibility. Enter a hostname and optional port to see whether the server negotiates a post-quantum key exchange algorithm.

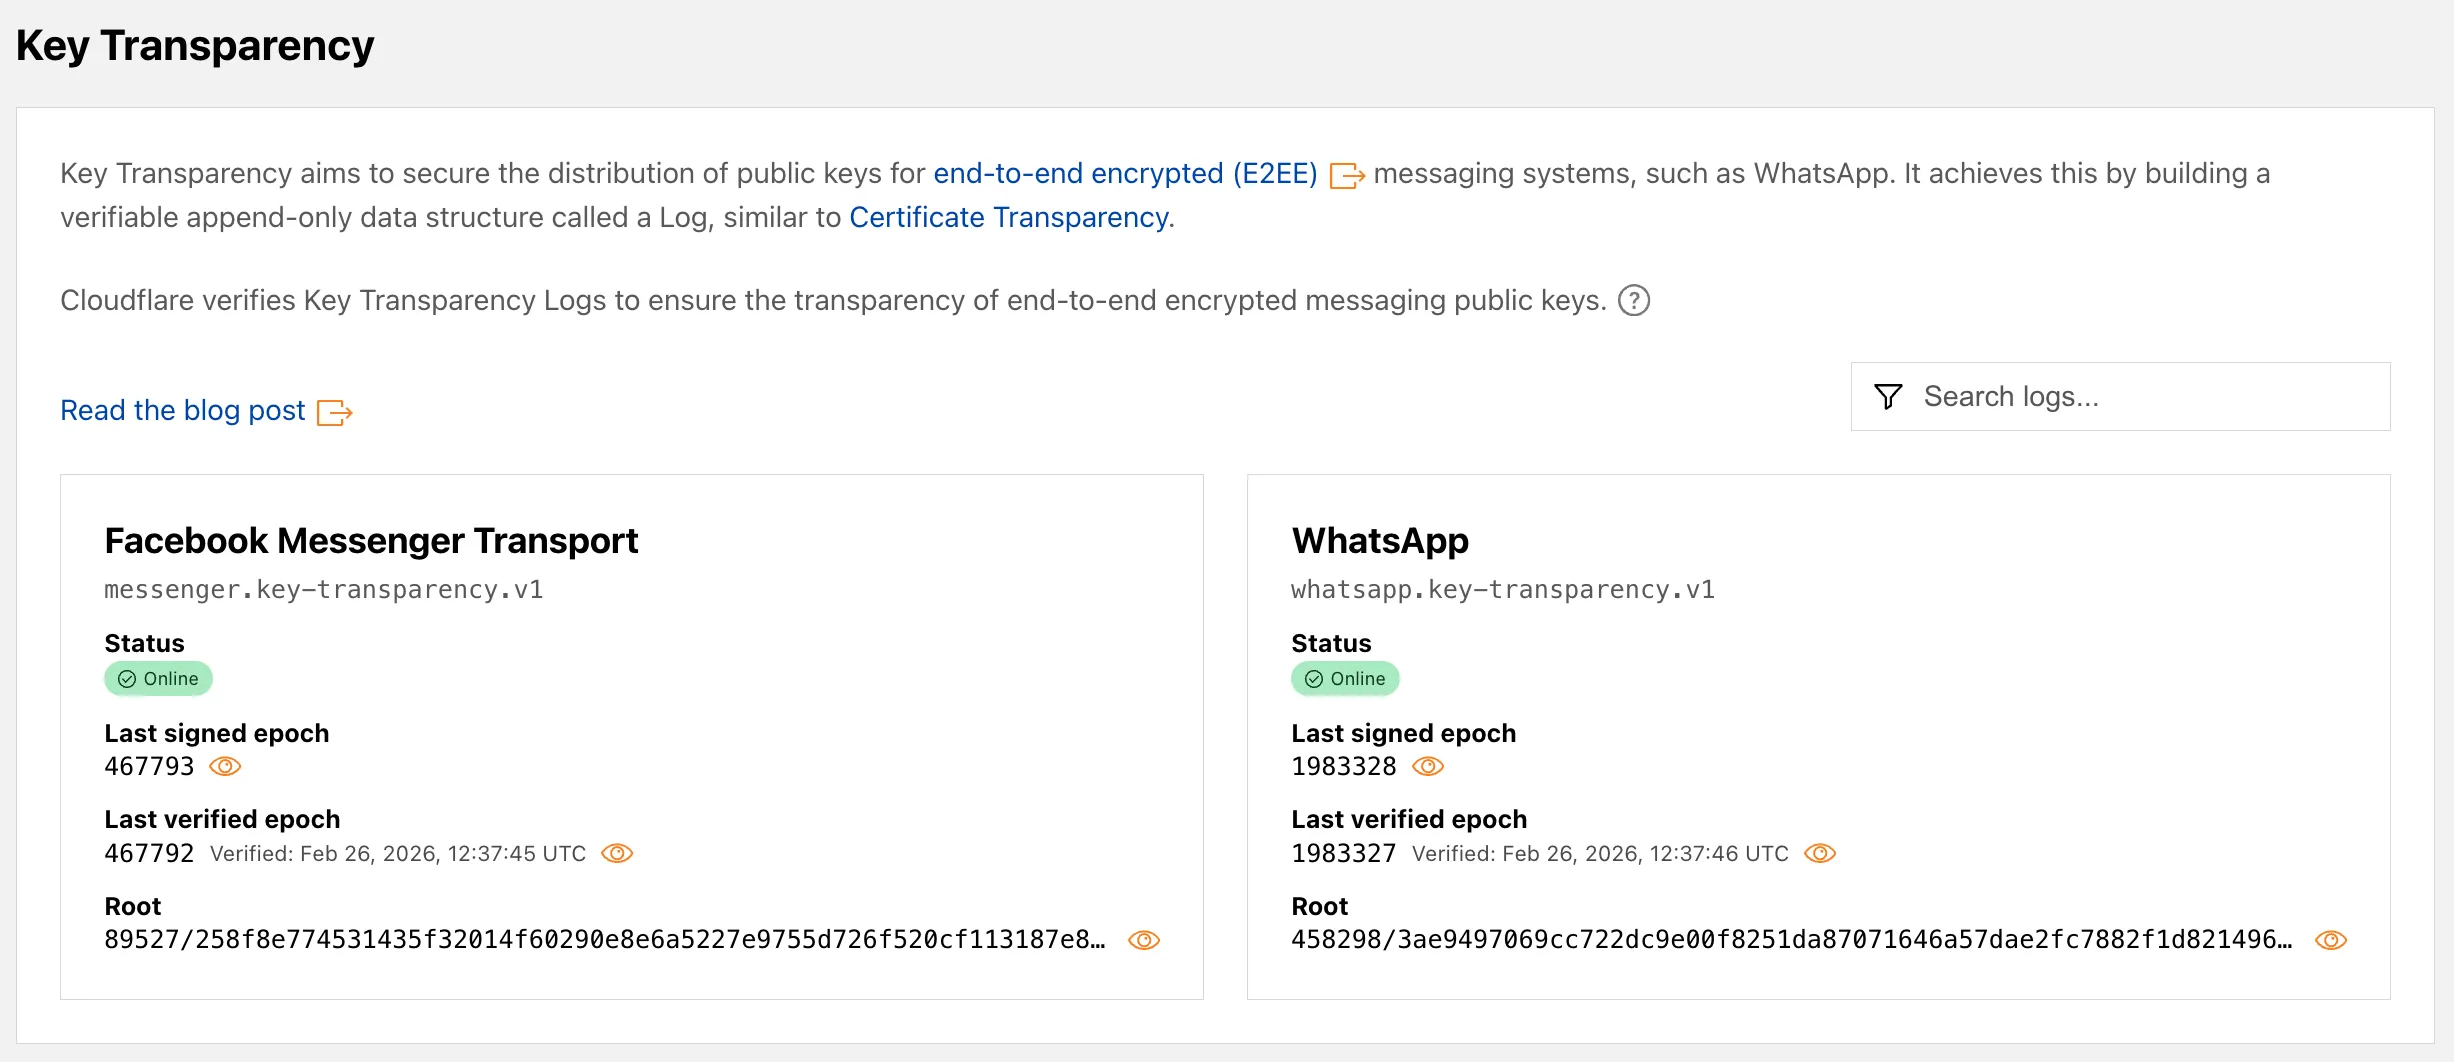
A new Key Transparency ↗ section displays the audit status of Key Transparency logs for end-to-end encrypted messaging services. The page launches with two monitored logs: WhatsApp and Facebook Messenger Transport.
Each log card shows the current status, last signed epoch, last verified epoch, and the root hash of the Auditable Key Directory tree. The data is also available through the Key Transparency Auditor API.
Learn more about these features in our blog post ↗ and check out the Post-Quantum Encryption ↗ and Key Transparency ↗ pages to explore the data.
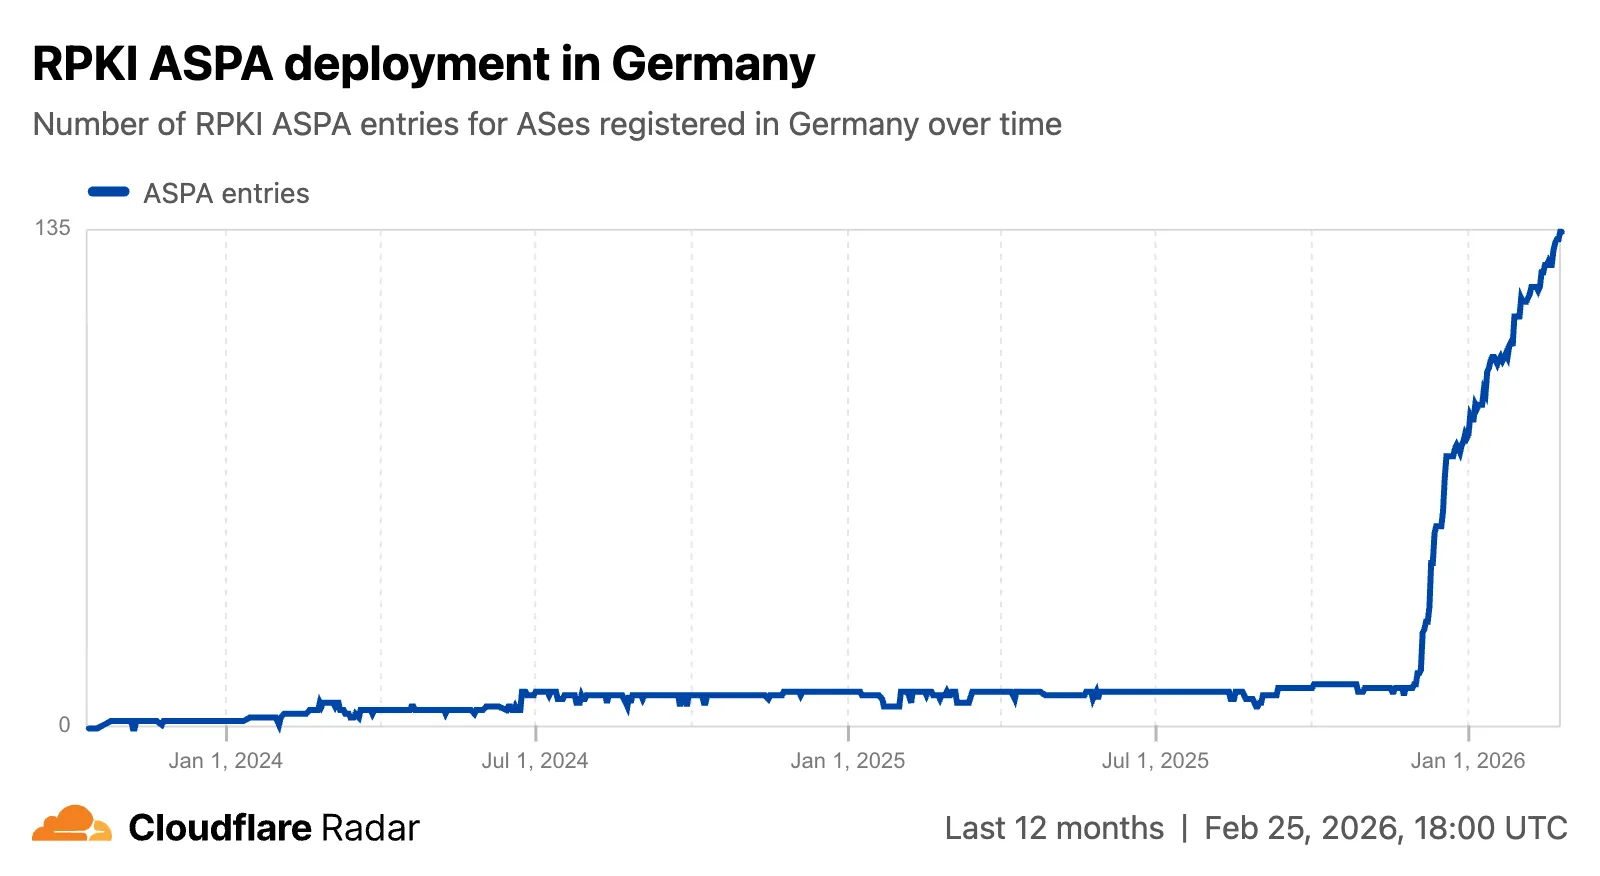
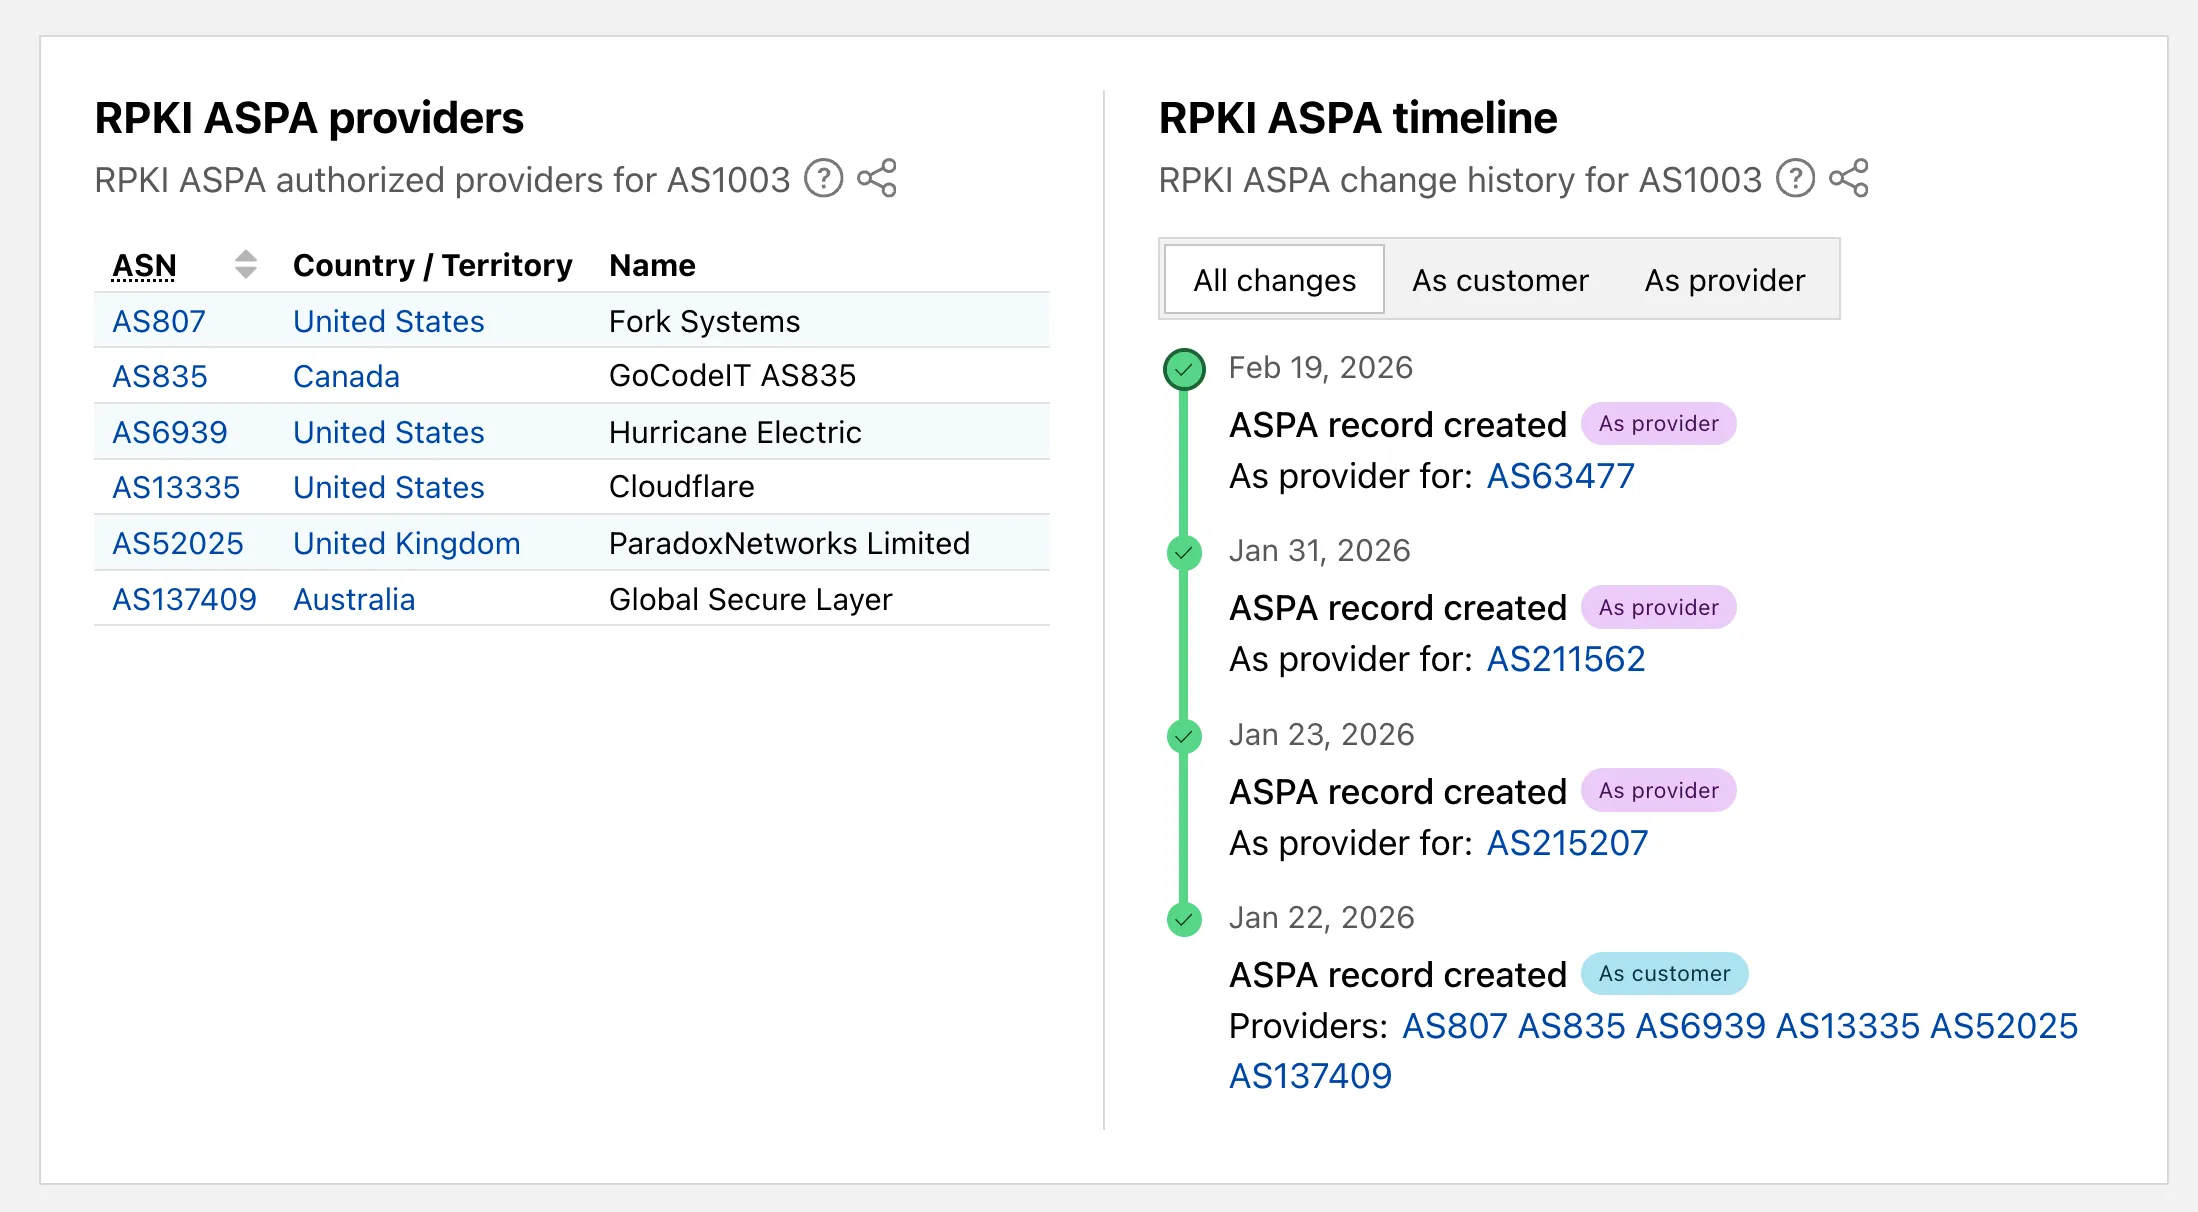
Radar now includes Autonomous System Provider Authorization (ASPA) ↗ deployment insights, providing visibility into the adoption and verification of ASPA objects across the global routing ecosystem.
The new
ASPAAPI provides the following endpoints:/bgp/rpki/aspa/snapshot- Retrieves current or historical ASPA objects./bgp/rpki/aspa/changes- Retrieves changes to ASPA objects over time./bgp/rpki/aspa/timeseries- Retrieves ASPA object counts over time as a timeseries.
The global routing page ↗ now shows the ASPA deployment trend over time by counting daily ASPA objects.

The global routing page also displays the most recent ASPA objects, searchable by ASN or AS name.

On country and region routing pages, a new widget shows the ASPA deployment rate for ASNs registered in the selected country or region.
On AS routing pages, the connectivity table now includes checkmarks for ASPA-verified upstreams. All ASPA upstreams are listed in a dedicated table, and a timeline shows ASPA changes at daily granularity.
Check out the Radar routing page ↗ to explore the data.
Radar now includes content type insights for AI bot and crawler traffic. The new
content_typedimension and filter shows the distribution of content types returned to AI crawlers, grouped by MIME type category.The content type dimension and filter are available via the following API endpoints:
Content type categories:
- HTML - Web pages (
text/html) - Images - All image formats (
image/*) - JSON - JSON data and API responses (
application/json,*+json) - JavaScript - Scripts (
application/javascript,text/javascript) - CSS - Stylesheets (
text/css) - Plain Text - Unformatted text (
text/plain) - Fonts - Web fonts (
font/*,application/font-*) - XML - XML documents and feeds (
text/xml,application/xml,application/rss+xml,application/atom+xml) - YAML - Configuration files (
text/yaml,application/yaml) - Video - Video content and streaming (
video/*,application/ogg,*mpegurl) - Audio - Audio content (
audio/*) - Markdown - Markdown documents (
text/markdown) - Documents - PDFs, Office documents, ePub, CSV (
application/pdf,application/msword,text/csv) - Binary - Executables, archives, WebAssembly (
application/octet-stream,application/zip,application/wasm) - Serialization - Binary API formats (
application/protobuf,application/grpc,application/msgpack) - Other - All other content types
Additionally, individual bot information pages ↗ now display content type distribution for AI crawlers that exist in both the Verified Bots and AI Bots datasets.
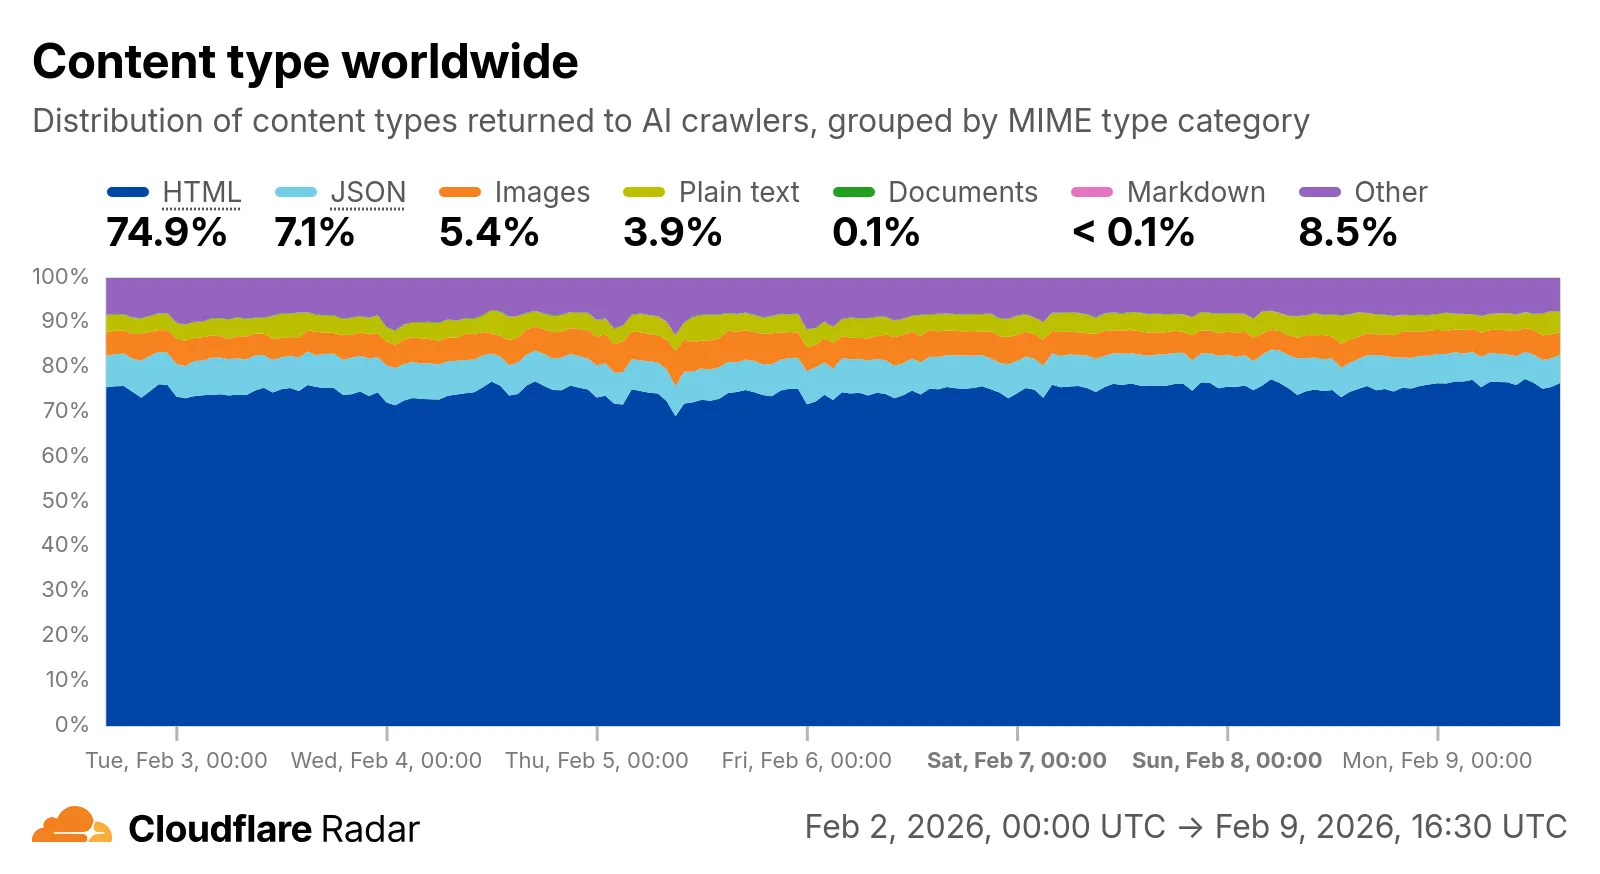
Check out the AI Insights page ↗ to explore the data.
- HTML - Web pages (
Radar introduces HTTP Origins insights, providing visibility into the status of traffic between Cloudflare's global network and cloud-based origin infrastructure.
The new
OriginsAPI provides provides the following endpoints:/origins- Lists all origins (cloud providers and associated regions)./origins/{origin}- Retrieves information about a specific origin (cloud provider)./origins/timeseries- Retrieves normalized time series data for a specific origin, including the following metrics:REQUESTS: Number of requestsCONNECTION_FAILURES: Number of connection failuresRESPONSE_HEADER_RECEIVE_DURATION: Duration of the response header receiveTCP_HANDSHAKE_DURATION: Duration of the TCP handshakeTCP_RTT: TCP round trip timeTLS_HANDSHAKE_DURATION: Duration of the TLS handshake
/origins/summary- Retrieves HTTP requests to origins summarized by a dimension./origins/timeseries_groups- Retrieves timeseries data for HTTP requests to origins grouped by a dimension.
The following dimensions are available for the
summaryandtimeseries_groupsendpoints:region: Origin regionsuccess_rate: Success rate of requests (2XX versus 5XX response codes)percentile: Percentiles of metrics listed above
Additionally, the
AnnotationsandTraffic AnomaliesAPIs have been extended to support origin outages and anomalies, enabling automated detection and alerting for origin infrastructure issues.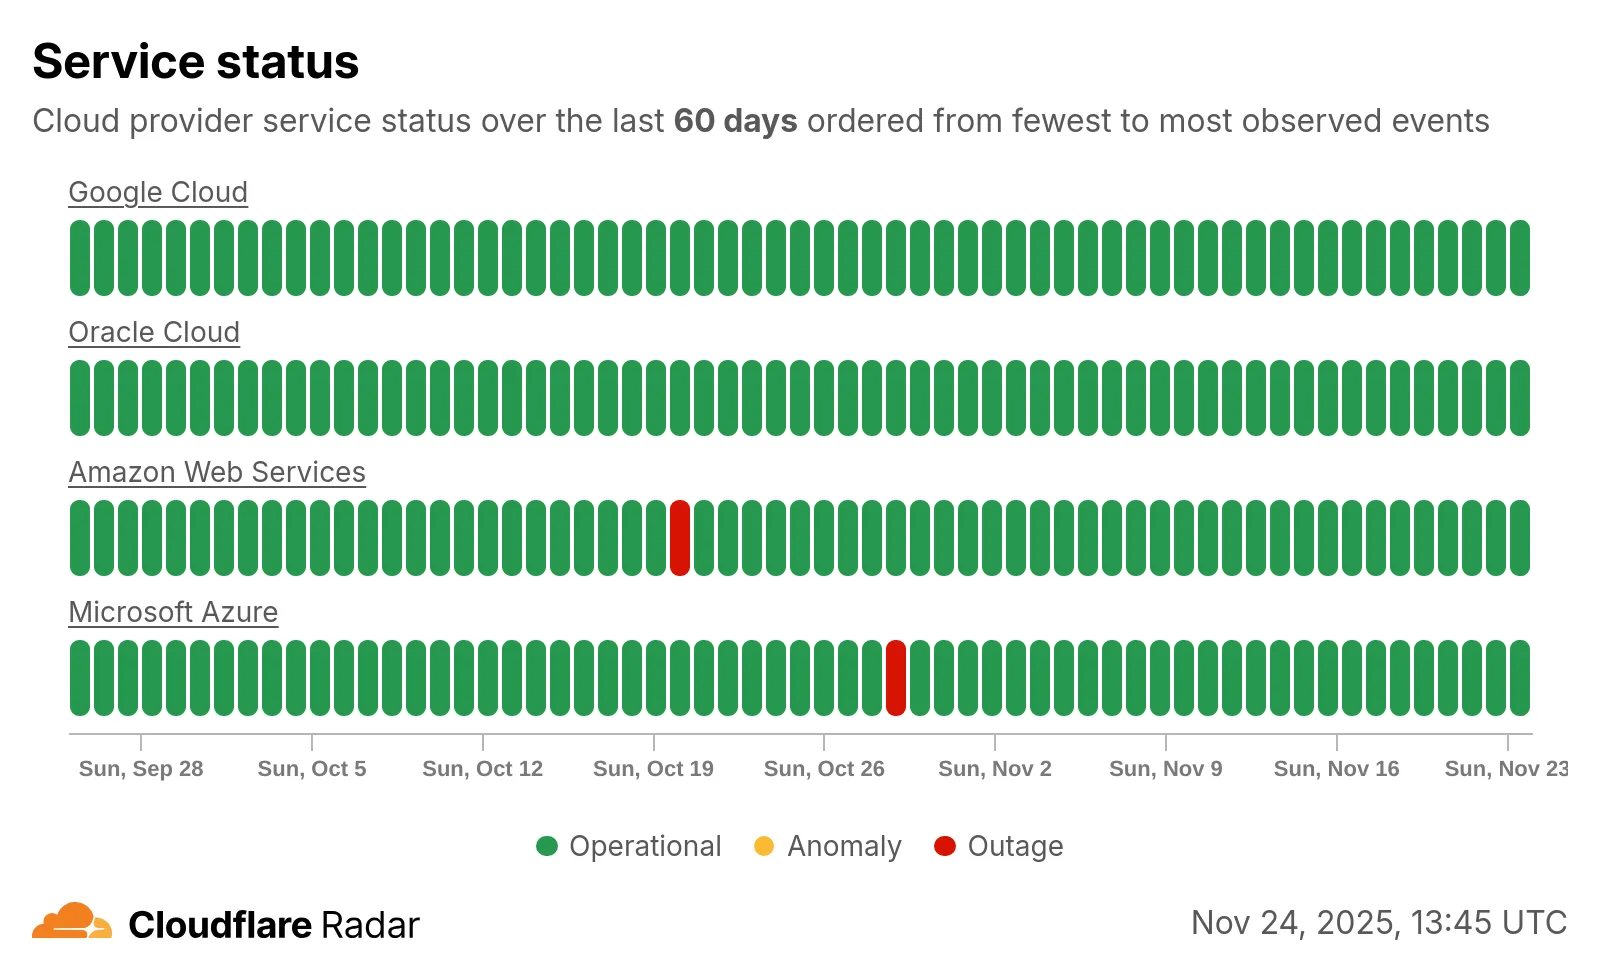
Check out the new Radar page ↗.
Radar now introduces Top-Level Domain (TLD) insights, providing visibility into popularity based on the DNS magnitude metric, detailed TLD information including its type, manager, DNSSEC support, RDAP support, and WHOIS data, and trends such as DNS query volume and geographic distribution observed by the 1.1.1.1 DNS resolver.
The following dimensions were added to the Radar DNS API, specifically, to the
/dns/summary/{dimension}and/dns/timeseries_groups/{dimension}endpoints:tld: Top-level domain extracted from DNS queries; can also be used as a filter.tld_dns_magnitude: Top-level domain ranking by DNS magnitude.
And the following endpoints were added:
/tlds- Lists all TLDs./tlds/{tld}- Retrieves information about a specific TLD.

Learn more about the new Radar DNS insights in our blog post ↗, and check out the new Radar page ↗.
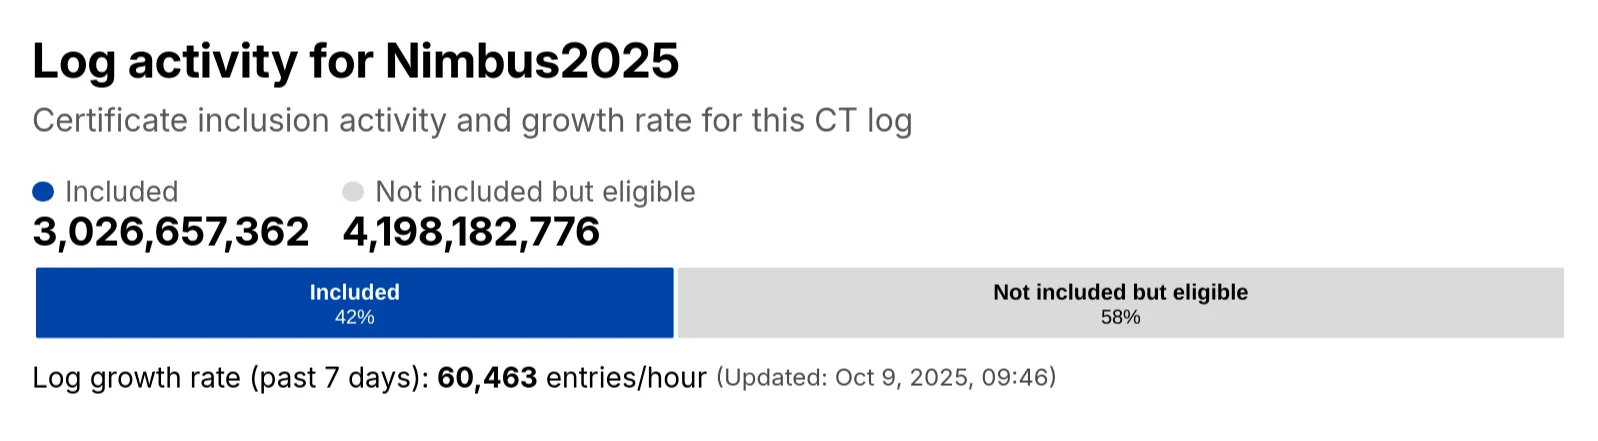
Radar has expanded its Certificate Transparency (CT) log insights with new stats that provide greater visibility into log activity:
- Log growth rate: The average throughput of the CT log over the past 7 days, measured in certificates per hour.
- Included certificate count: The total number of certificates already included in this CT log.
- Eligible-for-inclusion certificate count: The number of certificates eligible for inclusion in this log but not yet included. This metric is based on certificates signed by trusted root CAs within the log’s accepted date range.
- Last update: The timestamp of the most recent update to the CT log.
These new statistics have been added to the response of the Get Certificate Log Details API endpoint, and are displayed on the CT log information page ↗.
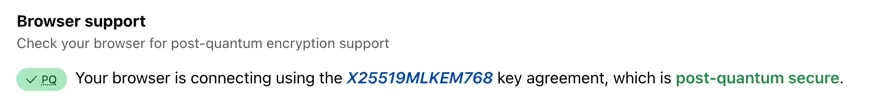
Radar now includes browser detection for Post-quantum (PQ) encryption. The Post-quantum encryption card ↗ now checks whether a user’s browser supports post-quantum encryption. If support is detected, information about the key agreement in use is displayed.
Radar now introduces Regional Data, providing traffic insights that bring a more localized perspective to the traffic trends shown on Radar.
The following API endpoints are now available:
Get Geolocation- Retrieves geolocation bygeoId.List Geolocations- Lists geolocations.NetFlows Summary By Dimension- Retrieves NetFlows summary by dimension.
All
summaryandtimeseries_groupsendpoints inHTTPandNetFlowsnow include anadm1dimension for grouping data by first level administrative division (for example, state, province, etc.)A new filter
geoIdwas also added to all endpoints inHTTPandNetFlows, allowing filtering by a specific administrative division.Check out the new Regional traffic insights on a country specific traffic page new Radar page ↗.
Radar now introduces Certificate Transparency (CT) insights, providing visibility into certificate issuance trends based on Certificate Transparency logs currently monitored by Cloudflare.
The following API endpoints are now available:
/ct/timeseries: Retrieves certificate issuance time series./ct/summary/{dimension}: Retrieves certificate distribution by dimension./ct/timeseries_groups/{dimension}: Retrieves time series of certificate distribution by dimension./ct/authorities: Lists certification authorities./ct/authorities/{ca_slug}: Retrieves details about a Certification Authority (CA). CA information is derived from the Common CA Database (CCADB) ↗./ct/logs: Lists CT logs./ct/logs/{log_slug}: Retrieves details about a CT log. CT log information is derived from the Google Chrome log list ↗.
For the
summaryandtimeseries_groupsendpoints, the following dimensions are available (and also usable as filters):ca: Certification Authority (certificate issuer)ca_owner: Certification Authority Ownerduration: Certificate validity duration (between NotBefore and NotAfter dates)entry_type: Entry type (certificate vs. pre-certificate)expiration_status: Expiration status (valid vs. expired)has_ips: Presence of IP addresses in certificate Subject Alternative Names (SANs) ↗has_wildcards: Presence of wildcard DNS names in certificate SANslog: CT log namelog_api: CT log API (RFC6962 ↗ vs. Static ↗)log_operator: CT log operatorpublic_key_algorithm: Public key algorithm of certificate's keysignature_algorithm: Signature algorithm used by CA to sign certificatetld: Top-level domain for DNS names found in certificates SANsvalidation_level: Validation level ↗
Check out the new Certificate Transparency insights in the new Radar page ↗.